
Topics Covered
Power BI Fundamentals
Below are some key concepts to learn about Power BI before diving into DAX.
- Different views in Power BI for different purposes
- Loading and connecting multiple datasets
- Building data models & creating relationships between tables in model view
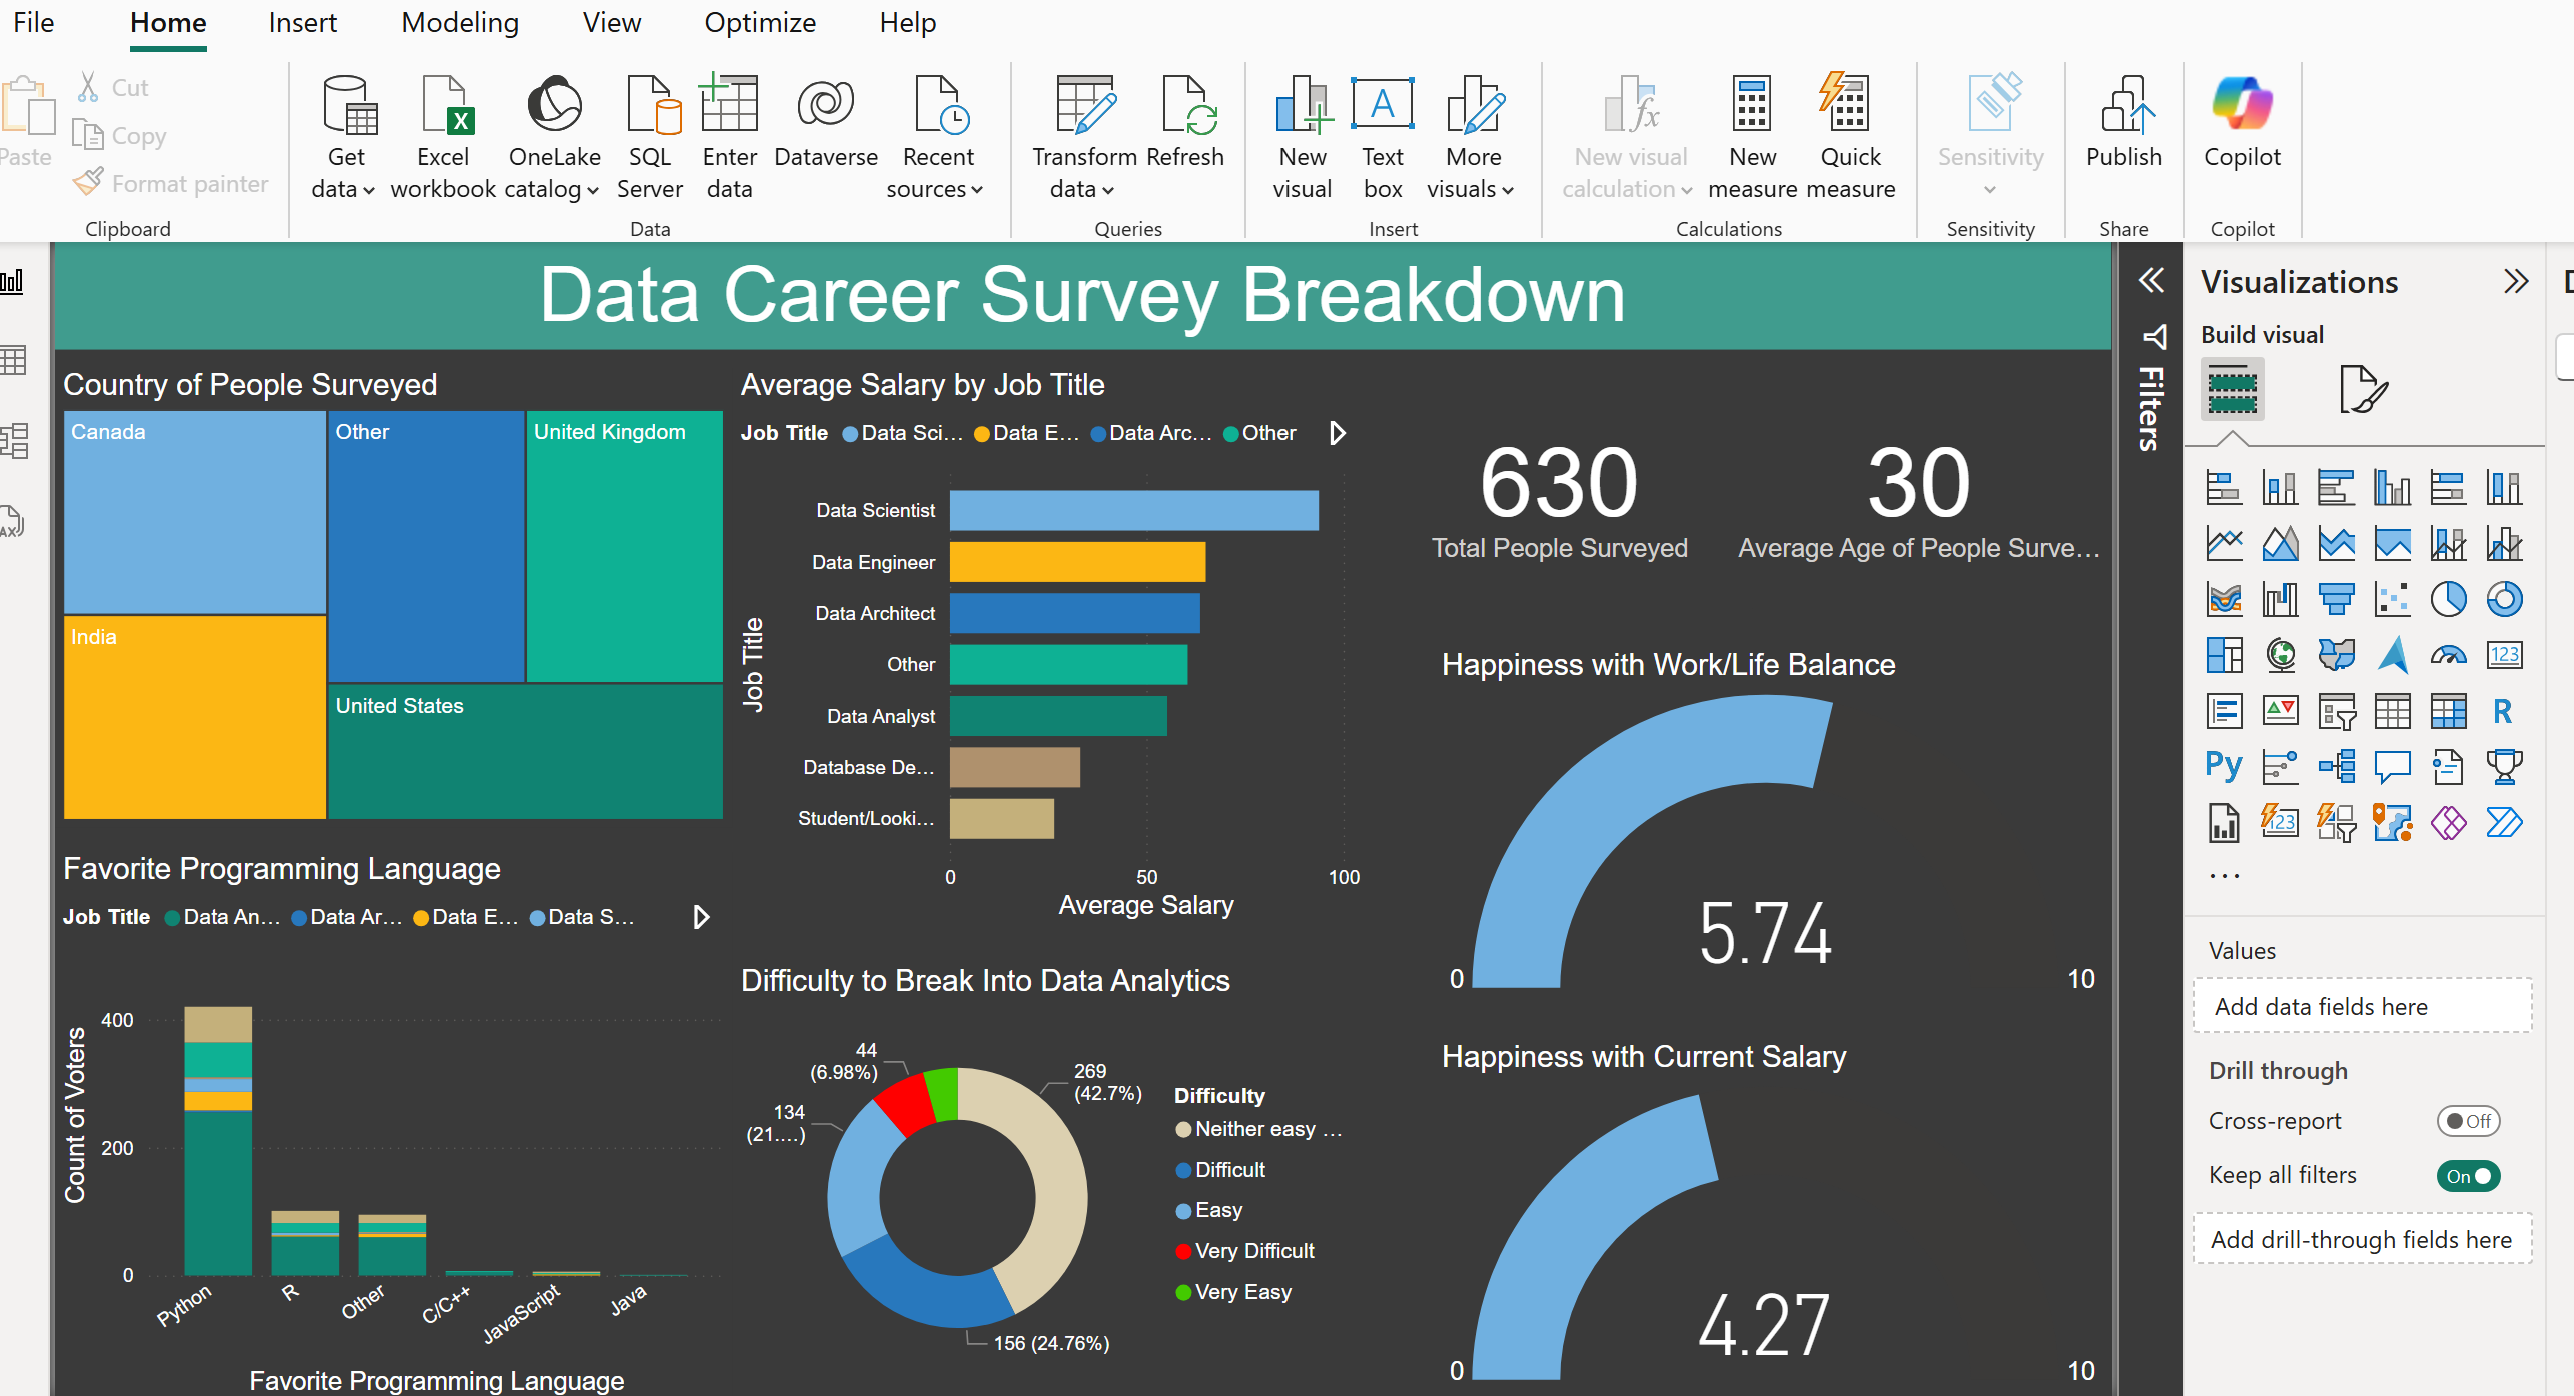
- Creating interactive reports in report view
- Using Power Query Editor for data prep and cleaning
- Creating and formatting various visualizations (matrix, doughnut charts, etc.)
- Building hierarchies for drill-down capabilities
- Mastering sorting, filtering, and interactivity controls
DAX (Data Analysis Expressions)
DAX is to Power BI what formulas are to Excel - it's the formula language that powers calculations.
Key DAX Concepts:
- Used for creating columns, tables, and measures
- Similar to Excel formulas (but more powerful)
- Used across Microsoft tools (Analysis Services, Power Pivot)
- Context is crucial - DAX behaves differently based on:
- Row context (for calculated columns)
- Filter context (for measures)
Common Function Examples:
- Aggregation (SUM, AVERAGE, MIN, MAX)
- Date and Time (DATEDIFF, EOMONTH, DATEADD)
- Logical (IF, SWITCH, AND, OR)
- Text (LEFT, RIGHT, CONCATENATE)
- Filter (CALCULATE, FILTER, ALL)
- Time Intelligence (SAMEPERIODLASTYEAR, YTD)
// Basic Aggregation:
Total Sales = SUM(Sales[Amount])
// Filtered Calculation (using CALCULATE):
Total US Sales = CALCULATE(SUM(Sales[Amount]), Region[Country]="USA")
// Year over Year Growth:
YoY Growth =
DIVIDE(
    [Total Sales] - CALCULATE([Total Sales], SAMEPERIODLASTYEAR(Dates[Date])),
    CALCULATE([Total Sales], SAMEPERIODLASTYEAR(Dates[Date]))
)
Calculated Columns vs Measures in Power BI (DAX)
Both calculated columns and measures are used to create new values in Power BI, but they work differently.
What is a Calculated Column?
A calculated column creates a new column in a table by evaluating row-by-row (row context). The value is stored in the table and calculated once, when the data is refreshed.
Example: Adding a "Total Sales" Column
Let's say we have a Sales table:
| Product | Quantity | Unit Price |
|---|---|---|
| Apple | 2 | 5 |
| Banana | 3 | 4 |
| Orange | 1 | 6 |
Now, we add a calculated column to find Total Sales:
Total Sales = Sales[Quantity] * Sales[Unit Price]
This creates a new column:
| Product | Quantity | Unit Price | Total Sales |
|---|---|---|---|
| Apple | 2 | 5 | 10 |
| Banana | 3 | 4 | 12 |
| Orange | 1 | 6 | 6 |
Key Points:
- Stored in the table (takes up memory)
- Calculated for each row during data refresh
- Useful for row-level calculations like concatenation, ranking, or static values
What is a Measure?
A measure is a dynamic calculation that works with aggregations and respects the filter context (e.g., slicers, reports, visuals). It is calculated on the fly when needed.
Example: Creating a "Total Sales" Measure
Total Sales Measure = SUMX(Sales, Sales[Quantity] * Sales[Unit Price])
This measure calculates Total Sales dynamically when used in a visual.
- If you add Product and Total Sales Measure to a table visual, it will sum sales dynamically per product.
- If you use it in a card visual, it will sum everything.
- If you apply a filter (e.g., only show "Apple"), it recalculates on the fly.
Key Points:
- Not stored (efficient, saves memory)
- Calculated only when needed (better performance)
- Changes dynamically based on report filters and slicers
- Best for aggregations (SUM, AVERAGE, MAX, etc.)
Key Differences
| Feature | Calculated Column | Measure |
|---|---|---|
| When Calculated? | When data is refreshed (static) | Dynamically when used in a visual |
| Where Stored? | Inside the table (takes up space) | Not stored, recalculates when needed |
| Context? | Works in row context (one row at a time) | Works in filter context (depends on report filters) |
| Best Used For? | Row-based calculations (concatenation, ranks) | Aggregations (SUM, AVERAGE, TOTAL) |
| Performance | Uses more memory (stored in table) | More efficient (calculated on demand) |
When to Use What?
Use a Calculated Column When:
- You need row-by-row calculations (e.g., "Total Sales" = Quantity * Price)
- You need the result stored in the table for sorting or filtering
- You need a static value that doesn't change dynamically
Use a Measure When:
- You need a dynamic calculation that responds to filters and slicers
- You are working with aggregations like SUM, AVERAGE, COUNT
- You want to optimize performance by reducing storage
Performance Optimization in DAX
Speaking of performance, to improve the performance of DAX formulas, especially in large datasets, follow these optimization practices:
| Best Practice | Description |
|---|---|
| Use measures over calculated columns | Measures are dynamic and calculated on demand, consuming less memory than calculated columns |
| Avoid nested iterations | Minimize the use of complex nested functions (e.g., SUMX, AVERAGEX) to prevent performance bottlenecks |
| Filter early | Apply filters at the data source or in DAX formulas to reduce the number of rows processed |
| Leverage variables | Use VAR to store intermediate results and avoid redundant calculations within a formula |
| Simplify relationships | Ensure the data model has clear relationships and appropriately indexed tables for faster processing |
| Optimize cardinality | Reduce the number of unique values in columns used for filtering or joining to enhance performance |
DAX Best Practices:
- Format your DAX code with line breaks for readability
- Use variables (VAR) for complex calculations
- Comment your complex measures
- Be careful with CALCULATE - it modifies filter context
- Use DIVIDE instead of division operator (/) for better error handling
💡 Note: Use Performance Analyzer in Power BI Desktop to identify which DAX calculations are taking the most time to execute.
Understanding DAX Context Types
Row Context
Row context is the most basic form of context in DAX:
- One row at a time evaluation
- Automatically exists in calculated columns
- Like a "cursor" moving row by row through a table
- Examples:
// Simple row context example

Full Name = [First Name] & " " & [Last Name]


// Row context with calculation

Margin = [Sales Price] - [Cost]


// Row context accessing related tables

Product Category = RELATED(Products[Category])
💡 Note: Row context doesn't automatically exist in measures - you need iterator functions (like SUMX) to create row context in measures.
Filter Context
Filter context determines which rows are included in calculations:
- Sources of filter context:
- Report filters and slicers
- Relationships between tables
- Visual level filters
- DAX functions (CALCULATE, FILTER, etc.)
- Examples:
// Basic filter context

US Sales = CALCULATE(
    SUM(Sales[Amount]),
    Region[Country] = "USA"
)


// Multiple filters

High Value US Sales = CALCULATE(
    SUM(Sales[Amount]),
    Region[Country] = "USA",
    Sales[Amount] > 10000
)


// Modifying filter context

All Categories Sales = CALCULATE(
    [Total Sales],
    ALL(Products[Category])
)
💡 Note: Filter context can be modified using CALCULATE and other filter-modifying functions.
Context Interaction Tips:
- Row context and filter context can exist simultaneously
- CALCULATE always creates a new filter context
- Iterator functions (SUMX, AVERAGEX) create row context
- Use CALCULATE to modify existing filter context
- Use ALL/ALLSELECTED to remove filter context
💡 Note: Understanding these contexts is crucial for writing correct DAX formulas. When troubleshooting, always consider which contexts are in play.
Understanding Iterator Functions in DAX
Think of iterator functions as a way to loop through each row of data, like going through a shopping list item by item. Instead of just getting a total, you can perform calculations on each row before getting the final result.
Common Iterator Functions Explained Simply
- SUMX - Goes through each row, performs a calculation, then adds up all the results
// Calculate total revenue by multiplying quantity and price for each row Total Revenue = SUMX( Sales, // Look at each row in the Sales table Sales[Quantity] * // Multiply quantity Sales[Price] // by price ) - AVERAGEX - Like SUMX, but takes the average instead of the sum
// Calculate average order value per customer Avg Order Value = AVERAGEX( Customers, // Look at each customer CALCULATE(SUM(Sales[Amount])) // Add up their sales ) - MAXX/MINX - Finds the highest/lowest value after performing a calculation
// Find the highest single-day revenue
Highest Daily Revenue =
MAXX(
    Dates,                             // Look at each date
    CALCULATE(SUM(Sales[Amount]))      // Add up sales for that day
)
When to Use Iterator Functions
- When you need to perform calculations on each row before getting a final result
- When working with related tables (like customer sales across multiple orders)
- When you need to create running totals or moving averages
Iterator Function Tips:
- Use them when simple aggregations (SUM, AVERAGE) aren't enough
- Be careful with large tables - iterators can be slower than simple aggregations
- Consider using variables to store intermediate results
- Remember they create row context automatically
Real-World Example
Let's say you want to calculate the total profit, considering different discount levels for each product:
// Calculate total profit with minimum margin requirement
Total Profit =
    VAR MinimumMargin = 0.1  // 10% minimum margin
    RETURN
        SUMX(
            Sales,
            VAR Revenue = Sales[Quantity] * Sales[Price]
            VAR Cost = Sales[Quantity] * Sales[UnitCost]
            VAR Discount = Sales[DiscountPercentage]
            VAR FinalRevenue = Revenue * (1 - Discount)
            RETURN
                IF(
                    (FinalRevenue - Cost) / Cost >= MinimumMargin,
                    FinalRevenue - Cost,  // Actual profit
                    0                     // No profit if below minimum margin
                )
        )
Working with Dates in Power BI
Importance of Date Tables
A dedicated date table is crucial for accurate reporting, especially when using time-intelligence functions.
- Time intelligence functions require continuous dates without gaps
- Using dates from transaction tables can lead to incorrect results without error messages
- Enables filtering across multiple date attributes (Month, Year, etc.)
- Allows creation of custom calendar views and fiscal year definitions
- Supports time horizon analysis (e.g., Last 30 Days)
Date and Time Functions
Below are a couple DAX functions for working with dates and times. Using the date "November 1, 2023 9:00 PM" (The day the Texas Rangers won the World Series!!!):
// Basic date functions
Year = YEAR('Date'[DateTime])     // Returns: 2023
Quarter = QUARTER('Date'[DateTime]) // Returns: 4
Month = MONTH('Date'[DateTime])    // Returns: 11

// Formatting dates
WeekdayName = FORMAT('Date'[DateTime], "dddd") // Returns: Wednesday

// Time intelligence example
YTD Sales = CALCULATE(
    SUM(Sales[Amount]),
    DATESYTD('Date'[Date])
)
Creating Date Tables
There are two main methods to create a date table in DAX:
1. Using CALENDAR function:
Date Table =
CALENDAR(
    DATE(2020, 1, 1),    // Start date
    DATE(2020, 12, 31)   // End date
)
2. Using CALENDARAUTO function:
Date Table =
CALENDARAUTO(12)  // 12 represents fiscal year end month
Date Table Best Practices:
- Always use a dedicated date table for time intelligence calculations
- Ensure your date table has no gaps in dates
- Include relevant fiscal periods if needed
- Mark the table as a date table in Power BI for better performance
- Consider adding custom columns for specific business needs (fiscal periods, holidays, etc.)
Working with Quick Measures
Quick Measures allow you to create complex DAX calculations using a simple drag-and-drop interface, without writing DAX code directly.
Quick Measures can create:
- Aggregate calculations
- Filter-based computations
- Time-intelligence functions
- Rolling averages
- Year-to-date totals
Creating a Rolling Average Example
Below is a 3-month rolling average for monthly sales:
// Auto-generated DAX from Quick Measure
Rolling 3-Month Sales =
CALCULATE(
    AVERAGE(Sales[Amount]),
    DATESINPERIOD(
        'Dates'[Date],
        MAX('Dates'[Date]),
        -3,
        MONTH
    )
)
This measure:
- Takes the average sales amount for each month
- Includes the current month plus two months before
- For example:
- October's value = Average of (Aug + Sep + Oct)
- November's value = Average of (Sep + Oct + Nov)
- December's value = Average of (Oct + Nov + Dec)
When to Use Rolling Averages:
- To smooth out seasonal spikes in sales
- To show general business trends
- When monthly data is too volatile
- To compare performance across seasons
To visualize rolling averages effectively:
- Use line and column combination charts
- Show monthly sales as columns
- Display the 3-month rolling average as a line
- This helps you see both monthly performance and overall trends