Tableau Projects
Interactive dashboards and data visualizations
Sales Dashboard
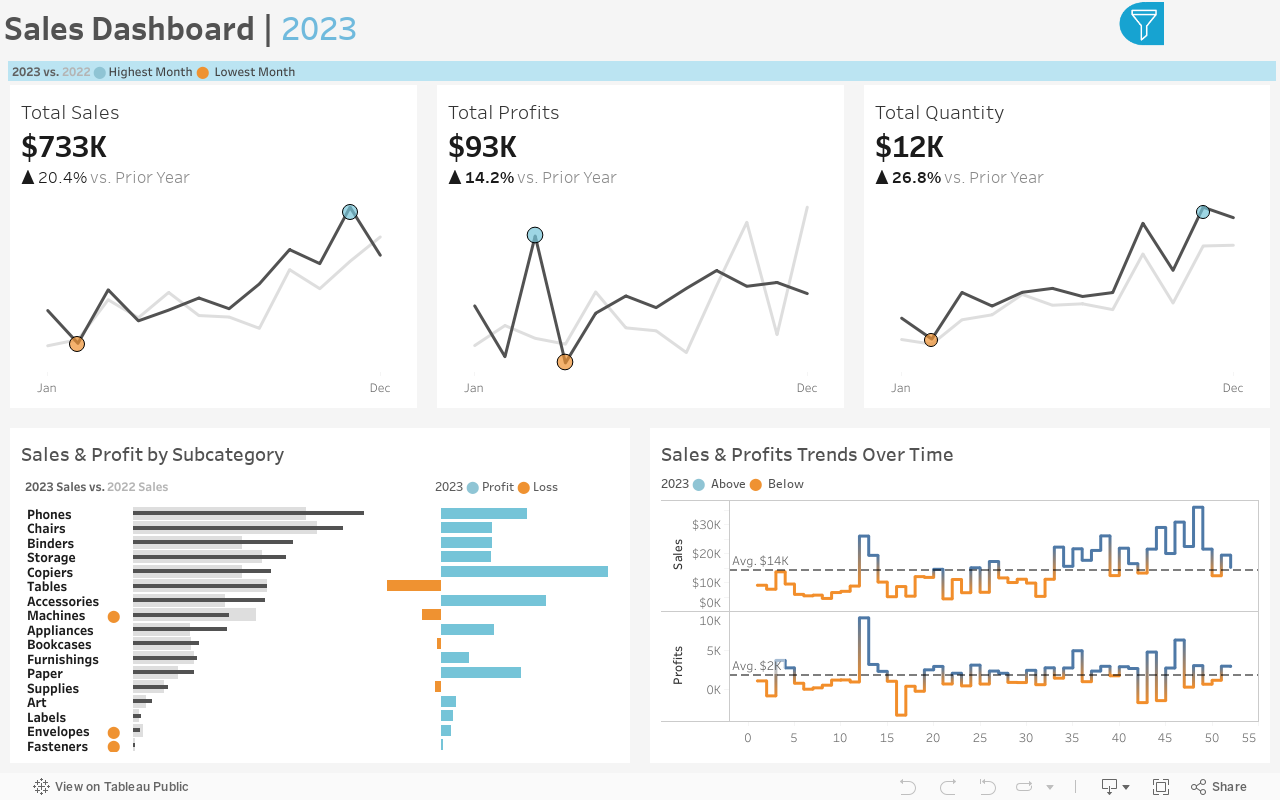
This Tableau dashboard analyzes sales data, providing insights into sales performance, regions, and product mix. The interactive dashboard allows users to explore various aspects of the sales data.