I am enjoying the TryHackMe SOC Level 1 course and have learned a lot from it so far. I recommend it to anyone looking to learn more about SOC fundamentals and security operations. I will update this page as I complete more rooms and labs.
Concepts that will be Covered in the Course
- Blue team introduction
- SOC Team Internals - Essential SOC skillys to triage, classify, and escalate alerts in real SOC environments.
- Core SOC Solutions - EDR, SIEM, Splunk, Elastic Stack (ELK), and SOAR
- Cyber Defense Frameworks - Pyramid of Pain, Cyber Kill Chain, MITRE
- Phishing Analysis - Introduction to Phishing with SOC simulator
- Network Traffic Analysis- Netowrk traffic analysis with Wireshark and NetworkMiner
- Network Security Monitoring - Network discovery detection, data exfiltration detection, IDS, and Snort.
- Web Security Monitoring - Detecting Web Attacks, Web Shells, and Web DDOS
- Windows Security Monitoring - Detecting Windows attacks
- Linux Security Monitoring - Detecting Linux attacks
- Malware Concepts for SOC - Malware classification and analysis and detecting living off the land attacks
- Threat Analysis Tools - Threat intelligence to detect, investigate and defend against adversaries
- SIEM Triage for SOC - Log analysis with SIEM, Alert Triage with Splunk and Elastic (ELK)
- SOC Level 1 Capstone Challenges
Tools & Technologies used so far
- SOC alert triage, reporting, workbooks, metrics and a lab for introduction to Phishing with SOC simulator
- EDR, SIEM, Splunk, Elastic Stack (ELK), and SOAR
- I will update this list as I complete more rooms and labs.
What I learned and Hands-On Experience
To demonstrate my understanding and practical skills, I completed the following hands-on rooms and exercises from the TryHackMe SOC Level 1 path:
Section 1: Blue Team Introduction
Blue Team and SOC fundamentals — why defensive security matters, how SOCs are structured, and where analysts fit in day-to-day operations.
-
Room: SOC Role in Blue Team
Learned what SOC is responsible for, how internal SOCs differ from MSSPs, and modern SOC career paths.
Internal SOC vs MSSP
- Internal SOC: Work for one organization, learn few tools but know them well, fewer attacks to learn from, limited to company's tech stack and security challenges.
- MSSP (Managed Security Service Provider): Work for provider supporting many clients, gain broad exposure to tools, industries, and attack patterns, deal with attacks and breaches weekly.
- Both paths build core SOC skills (monitoring, triage, investigation), but emphasize depth (internal) vs breadth (MSSP).
Career Tips
- Learn from every alert! Understand why a rule triggered and use it to sharpen your detection skills.
- Think like an attacker! Ask "why would they do this?" before diving into "how did they do it?".
- Verify everything! Never assume. Always validate alerts and suspicious behavior in logs.
- Get involved in incidents! Real attacks teach lessons no lab can. They are worth a sleepless night.
-
Room: Humans as Attack Vectors
Learned why and how people are targeted in cyber attacks and how the SOC helps defend them.
The Human Element
- Humans targeted for access they provide—mailboxes, applications, or internal systems.
- Easier to trick a "gatekeeper" into opening the gate than breaking down walls directly.
Attacks on Humans
- Social engineering manipulates people into helping attackers, knowingly or unknowingly.
- Phishing: Attackers send emails pretending to be trusted sources to trick people into clicking links or opening attachments (most common social engineering attack).
- Malware downloads: Threat actors embed malware in legitimate-looking files to trick users into downloading and executing.
- Deepfakes: Malicious actors use AI to create realistic fake videos or audio of people saying or doing things they never did.
- Impersonation: Attackers successfully impersonate legitimate people or organizations to gain trust and access.
Defending Humans
- Defending against threats involves Mitigation and Detection.
- Mitigation: Prevents or reduces chance and impact of attacks (training, anti-phishing solutions, etc.)
- Mitigation measures will eventually be bypassed—this is where SOC analysts come in.
- SOC analyst task: Detect and Investigate attacks.
- Mitigation solutions:
- Antivirus/EDR Solutions: Detect and block malware before damage occurs.
- Anti-phishing solutions: Email filters, sandboxing, and other tools to detect and block phishing emails.
- Security awareness programs: Teach employees to detect phishing and reinforce through phishing simulations.
- "Trust but verify": Teach employees to detect deepfakes and verify suspicious requests from "CEO" or "IT Department".
- Conclusion: Staying informed about latest attack trends is key to SOC analyst success. Recommended sites:
-
Room: Systems as Attack Vectors
Learned how attackers exploit vulnerable and misconfigured systems, and how to protect them.
Definition of a System
- If the lock on the main gate is fragile and cheap, guardian skills don't matter—enemy can sneak in while no one watches. In cyber terms, threat actors attack insecure systems directly, without users' knowledge.
Attacks on Systems
- Software vulnerabilities: In 2024, over 40,000 vulnerabilities published, with more than 300 actively exploited in major attacks.
- IT administrator risks: Weak passwords and unrestricted access increase attack surface.
- Supply chain attacks: Malware from trusted app or library. Threat actors breach one app/library and push malicious updates to all users. Single PC has hundreds of apps, each depending on thousands of libraries, creating massive attack surface.
- Notable examples: SolarWinds and 3CX breaches affected thousands of companies through supply chain compromises.
Vulnerabilities
- Software flaws can exist for years before discovery. Example: Shellshock vulnerability existed since 1992 but wasn't found until 2014.
- Zero-day vulnerabilities: Attackers discover flaws before defenders, requiring SOC skills to detect exploitation attempts before patches available.
- CVEs (Common Vulnerabilities and Exposures): Once vulnerabilities are public, assigned CVE numbers, starting race between attackers developing exploits and defenders rushing to patch.
- Patches answer CVEs, but for zero-days, must wait for vendor patches while using mitigation strategies:
- Restrict access to systems to only trusted IPs
- Apply temporary measures provided by the vendor
- Block known attack patterns on IPS or WAF
Misconfigurations
- Misconfigurations are not software bugs, but setup mistakes, often introduced by IT teams for convenience (e.g., simple passwords like "1111").
- Unlike vulnerabilities, misconfigurations don't require code changes or patches—they require better configuration and hardening.
- SOC analysts may discover misconfigurations only after attackers exploit them, but in smaller teams might also help proactively reduce them by:
- Penetration testing: Engage ethical hackers to simulate attacks and report discovered security flaws.
- Vulnerability scans: Run tools that detect default passwords, outdated software, and obvious gaps.
- Configuration audits: Manually review systems against best practices such as CIS benchmarks.
Conclusion
- Even though SOC analysts don't typically manage systems directly, understanding common attacks and defenses, and sharing with IT department, is key to expanding cybersecurity perspective.
- To grow quickly and be a strong team player, stay updated on latest threats and always share news with others!
- Recommended resources:
Section 2: SOC Team Internals
For this section I explored the essential SOC analyst skills to help triage, classify, and escalate alerts in real-world SOC environments.
-
Room: SOC L1 Alert Triage
What I Learned:
- Understood SOC alerts and how they are generated.
- Explored alert fields, statuses, and classification.
- Learned alert triage as an L1 analyst.
- Practiced with real alerts and SOC workflows to build speed and consistency.
- Prepared for SOC Simulator and SAL1 certification.
Events and Alerts:
- Alert solutions:
- SIEM Systems (Splunk ES, Elastic): Solid alert management, perfect for most SOC teams
- EDR or NDR (MS Defender, CrowdStrike): Provide own alert dashboards, but prefer SIEM or SOAR
- SOAR Systems (Splunk SOAR, Cortex SOAR): Larger SOC teams use to aggregate and centralize alerts from multiple solutions
- ITSM Systems (Jira, TheHive): Custom ticket management setup with dedicated solutions
- L1 Role in Alert Triage:
- SOC L1 Analysts: Review alerts, distinguish bad from good, notify L2 if real threat
- SOC L2 Analysts: Receive escalated alerts from L1, perform deeper analysis and remediation
- SOC Engineers: Ensure alerts contain enough information for efficient triage
- SOC Manager: Track speed and quality of alert triage to ensure real attacks aren't missed
Alert Properties
- Alert Time: Alert creation time (usually triggers minutes after event). Example: Alert Time: March 21, 15:35; Event Time: March 21, 15:32
- Alert Name: Summary of what happened, based on detection rule name. Example: Unusual Login Location
- Alert Severity: Defines urgency of alert. Example: High / Severe
- Alert Status: Shows if alert is being worked on or triage is complete.
- Alert Verdict: Also called classification, indicates if real threat or noise. Example: True Positive / Real Threat, False Positive / No Threat
- Alert Assignee: Shows assigned analyst (sometimes called alert owner; takes responsibility for alerts)
- Alert Description: Describes alert content: rule logic, why activity indicates attack, optionally how to triage
- Alert Fields: SOC analyst comments and values that triggered the alert.
Alert Priortization
- Filter alerts: Only take new, unseen, unresolved alerts—avoid those already reviewed or being investigated
- Sort by severity: Start with critical, then high, medium, low—critical alerts more likely to be real threats with greater impact
- Sort by time: Start with oldest alerts—older breaches may already be dumping data, newer ones just starting discovery
Alert Triage
- Initial Actions: Assign alert to yourself, move to In Progress, review alert name, description, key indicators—avoid interfering with alerts handled by others
- Investigation: Apply technical knowledge to analyze activity legitimacy in SIEM or EDR logs. Key steps:
- Identify who is under threat (affected user, hostname, cloud, network, or website)
- Note action described (suspicious login, malware, phishing)
- Review surrounding events for suspicious actions
- Use threat intelligence to verify
- Some teams provide Workbooks (playbooks/runbooks) for specific alert categories
- Final Actions: Decide if malicious (True Positive) or not (False Positive), prepare detailed comment with analysis steps and verdict reasoning, move to Closed status
-
LAB: SOC L1 Alert Reporting
What I Learned:
- Understood need for SOC alert reporting and escalation
- Learned how to write alert comments or case reports properly
- Explored escalation methods and communication best practices
- Applied knowledge to triage alerts in simulated environment
- Feel more confident in SOC Simulator and during SAL1 certification
Alert Funnel
- Alert Reporting: Before closing or passing alert to L2, may need to report it. Depending on team standards and alert severity, may require describing alert details and findingswith all relevant evidence instead of short comment. Especially important for True Positives requiring escalation.
- Alert Escalation: If True Positive requires additional actions or deeper investigation, escalate to L2 analyst following agreed procedures. Alert report provides initial context so L2 spends less time analyzing from scratch.
- Communication: May need to communicate with other departments during or after analysis. Examples: Ask IT team to confirm granting administrative privileges to users, or contact HR for information about newly hired employee.
Reporting Guide
- Report Purpose:
- Provide context for escalation: Well-written report saves time for L2 analysts to quickly understand what happened
- Save findings for records: Raw SIEM logs stored for 3-12 months, but alerts kept indefinitely—better to keep all context inside alert
- Improve investigation skills: If you can't explain it simply, you don't understand it well enough. Report writing boosts L1 skills by summarizing alerts
- Reporting Format:Follow Five Ws approach:
- Who: Which user logs in, runs command, or downloads file
- What: What exact action or event sequence was performed
- When: When exactly did suspicious activity start and end
- Where: Which device, IP, or website was involved in alert
- Why: Most important W—reasoning for your final verdict
-
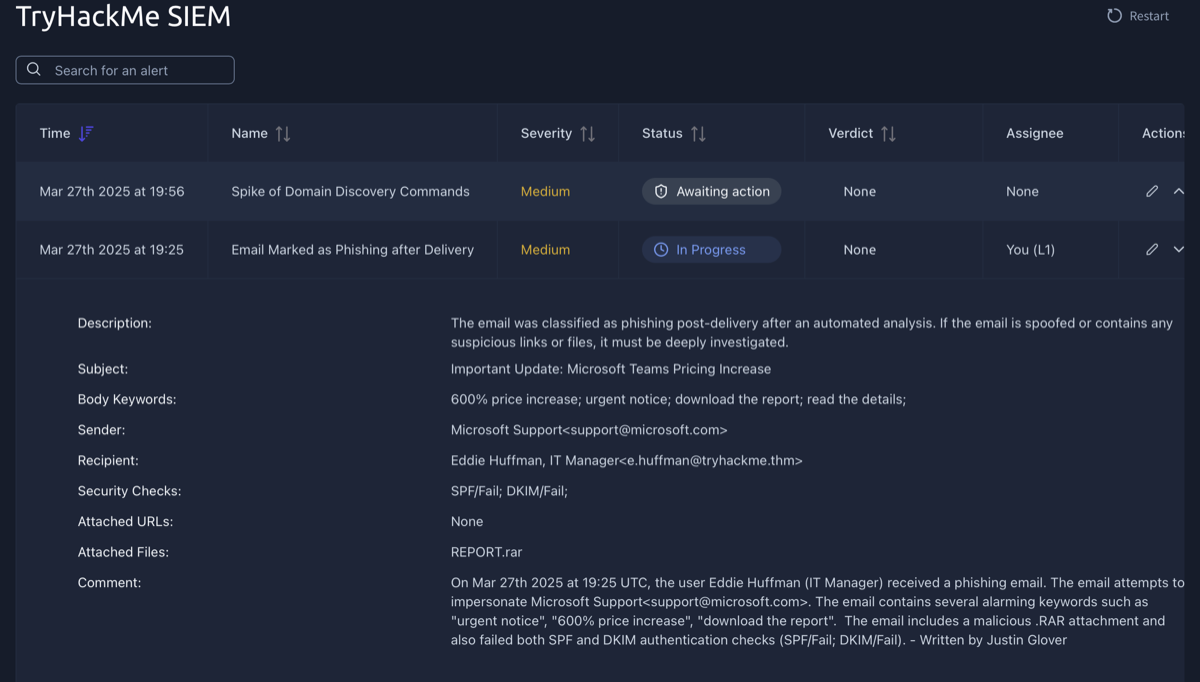
This task involved writing an alert report for a True Positive alert. The alert is described above, and my alert report is in the comments section as indicated by "Written by: Justin Glover".
Escalation Guide
- When to Escalate: Escalate alerts if:
- Alert indicates major cyberattack requiring deeper investigation or DFIR
- Remediation actions required (malware removal, host isolation, password reset)
- Communication needed with customers, partners, management, or law enforcement
- You don't fully understand alert and need help from senior analysts
- Requesting L2 Support: L1 to request senior support if something unclear. Especially in first months, better to discuss alert and clarify SOC procedures than blindly close alert you don't understand.
-
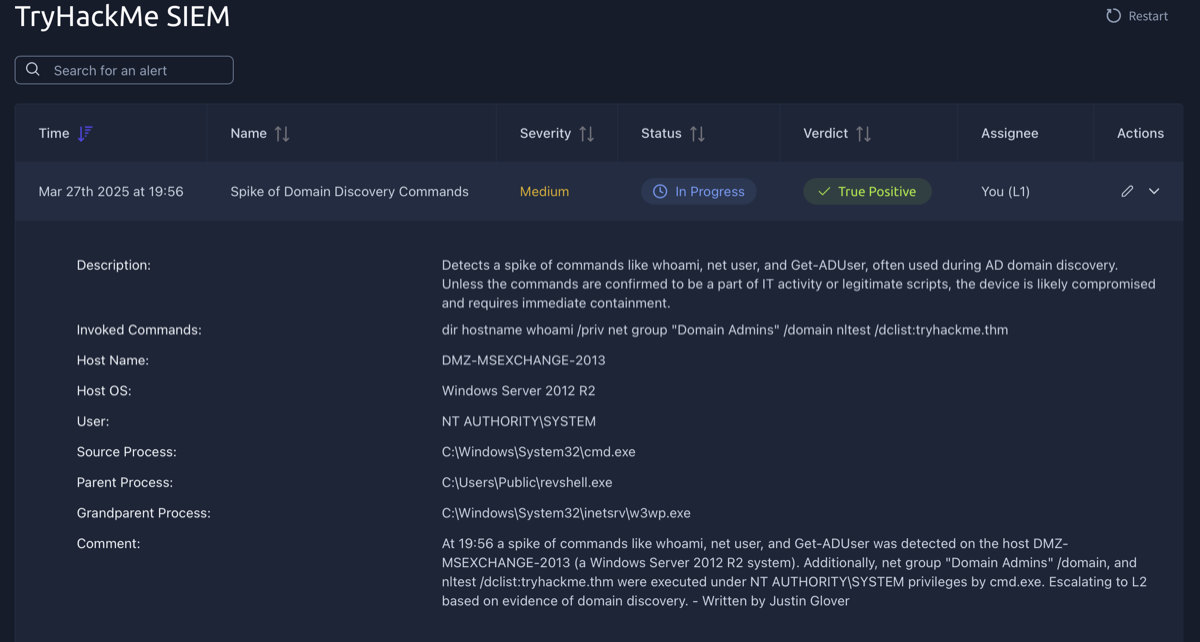
This task involved writing an alert report and escalating it to L2. The alert is described above, and my alert report is in the comments section as indicated by "Written by: Justin Glover".
-
Room: SOC Workbooks & Lookups
What I Learned:
- Discovered SOC investigation workbooks
- Learned where to find and how to use asset inventory in the SOC
- Importance of corporate network diagrams
- Practiced workflow building inside an interactive interface
Assets and Identities
- Sources of Identities:
- Active Directory (On-prem AD, Entra ID): AD itself is identity database, commonly used by SOC
- SSO Providers (Okta, Google Workspace): Cloud alternative for AD, easy way to manage and search users
- HR Systems (BambooHR, SAP, HiBob): Limited to employees only, but usually provides full employee data
- Custom Solution (CSV or Excel Sheets): Common for IT or security teams to maintain their own solutions
- Sources of Assets:
- Active Directory (On-prem AD, Entra ID): AD is also a solid asset inventory database
- SIEM or EDR (Elastic, CrowdStrike): Some SIEM or EDR agents collect information about monitored hosts
- MDM Solution (MS Intune, Jamf MDM): Dedicated olutions created to list and manage assets
- Custom Solution (CSV or Excel Sheets): Same as with identity inventory, custom solutions are common
-
Room: SOC Metrics and Objectives
What I Learned:
- SLA, MTTD, MTTA, and MTTR metrics
- The importance of the False Positive rate
- Why and how to improve the metrics as an L1 analyst
- Practice with managing SOC team performance metrics
Core Metrics
Metric Formula Measures Alerts Count AC = Total Count of Alerts ReceivedOverall load of SOC analysts False Positive Rate FPR = False Positives / Total AlertsLevel of noise in the alerts Alert Escalation Rate AER = Escalated Alerts / Total AlertsExperience of L1 analysts Threat Detection Rate TDR = Detected Threats / Total ThreatsReliability of the SOC team METRIC DETAILS
- Alerts Count: Too many alerts overwhelm analysts; too few indicate SIEM/visibility issues. Ideal: 5–30 alerts per day per L1 analyst (varies by org size).
- False Positive Rate (FPR): High FPR (80%+) causes fatigue and missed real threats. Requires rule tuning and false-positive remediation.
- Alert Escalation Rate: Measures how many alerts L1 escalates to L2. Target: <50%, ideally <20%. High = over-escalation; Low = missed threats.
- Threat Detection Rate (TDR): Should be 100%. Missed threats can cause ransomware or data exfiltration. Low TDR indicates broken rules, analyst error, or visibility gaps.
IMPROVING METRICS
- High False Positive Rate:
- Exclude trusted activity from rules
- Automate common alert triage (SOAR/scripts)
- Mean Time to Detect (MTTD) > 30 min:
- Optimize detection rule execution
- Ensure logs are collected in real time
- Mean Time to Acknowledge (MTTA) > 30 min:
- Enable real-time analyst notifications
- Balance alert distribution across analysts
- Mean Time to Respond (MTTR) > 4 hours:
- Quickly escalate to L2
- Maintain documented response procedures for attack scenarios
-
LAB - Phishing Simulator using Splunk
Learn how to use SOC Simulator by completing your first scenario. Close all True Positive alerts to pass!
Scenario objectives
- Monitor and analyze real-time alerts.
- Identify and document critical events such as suspicious emails and attachments.
- Create detailed case reports based on your observations to help your team understand the full scope of alerts and malicious activity.
Section 3: Core SOC Solutions
This section covers EDR, SIEM and SOAR, the core security solutions used in a SOC.
-
Room: Introduction to EDR
What I Learned:
- The basics of EDR and how it works
- How EDR differs from traditional Antivirus solutions
- The architecture of an EDR solution
- The types of telemetry it collects from endpoints
- The detection and response capabilities of an EDR
- Investigated a realistic alert in the EDR
What is an EDR?
- Endpoint Detection and Response (EDR) is a security solution that offers deep-level protection for endpoints.
EDR Solutions in the Market
- CrowdStrike Falcon
- SentinelOne ActiveEDR
- Microsoft Defender for Endpoint
- OpenEDR
- Symantec EDR
Three Pillars of an EDR Solution
- Visibility: Comprehensive monitoring and data collection from endpoints
- Detection: Identifying threats and suspicious activities through analysis
- Response: Taking action to contain, investigate, and remediate threats
Visibility
- EDR provides comprehensive visibility that distinguishes it from other endpoint security solutions
- Collects detailed data including process modifications, registry modifications, file and folder modifications, user actions, and more
- Presents information in a structured format with process trees and complete activity timelines
- Enables access to historical endpoint data for threat hunting and investigation
- All detections include full context for thorough analysis
Detection
- EDR detection capabilities exceed traditional methods by combining signature-based and behavior-based detections
- Uses machine learning to identify deviations from baseline behavior and flag unexpected user activities
- Can detect fileless malware that resides in memory
- Supports custom IOCs (Indicators of Compromise) for threat detection
- Tactic via Technique field maps detections to MITRE ATT&CK framework
Response
- EDR allows action on detected threats from a central console
- Actions can be executed on any endpoint, including isolating endpoints, terminating processes, or quarantining files
- Analysts can remotely connect to hosts and execute actions independently
Beyond the Antivirus
- Both AV and EDR aim to protect endpoints, but EDR provides deeper, broader protection
- Antivirus (AV) = immigration passport check:
- Compares "passports" (files) to a database of known criminals (signatures)
- Blocks threats only if they match known indicators
- Risk: a new/unknown attacker can pass through undetected
- EDR = security officers inside the airport:
- Continuously monitors what happens after entry using "CCTV/motion sensors" (behavior monitoring)
- Looks for suspicious behavior, such as:
- Hovering near restricted areas
- Unusual actions or patterns
- Leaving items unattended
- Can respond or alert with detailed context of what occurred
- Why EDR matters:
- AV may catch basic/known threats, but advanced threats can evade signatures
- EDR records and detects behaviors, not just known hashes/signatures
- Provides organization-wide visibility: If something suspicious appears on one endpoint, EDR can check and correlate across all endpoints
Attack Steps AV's Response EDR's Response Step #1 Does nothing if the downloaded file has no previous signature in the database Logs the file download activity and monitors it Step #2 Does nothing upon the opening of the document since winword.exe is a legitimate utility Records the execution of winword.exe and keeps monitoring Step #3 Does nothing if the executed macro has no previous signature Detects and flags the macro execution due to the unusual parent-child relationship of winword.exe and PowerShell.exe processes Step #4 Typically, AVs will not detect obfuscated PowerShell scripts Flags the obfuscated script execution Step #5 Will not flag malicious injection into svchost.exe since it does not monitor the memory injections Detects Process Injection in svchost.exe Step #6 Lacks Network Level Visibility Flags the unexpected behavior of svchost.exe, making an outbound connection Final Action May be marked as clean Generates an alert with the full attack chain and enables the analyst to take actions from within the EDR How an EDR works?
- EDR Agents (Sensors):
- Installed on endpoints and managed centrally
- Act as the eyes and ears of EDR
- Monitor endpoint activity in real time
- Perform basic signature-based and behavior-based detections
- Send detailed activity data and detections to the EDR console
- EDR Console:
- Serves as the central brain of EDR
- Correlates and analyzes data using logic, ML, and threat intelligence
- Turns correlated data into detections/alerts
- Provides a holistic dashboard showing security status across all endpoints
- After Detection (SOC Analyst Role):
- Analyst acknowledges and prioritizes alerts
- Alerts are severity-rated (Critical → Informational)
- Analyst reviews detailed context: Files, processes, network activity, registry changes, etc.
- Determines false positive vs true positive
- If true positive, takes response actions directly from the EDR console
- EDR in the Larger Security Ecosystem:
- Works alongside Firewalls, DLP, Email Security, IAM, etc.
- All tools typically integrate with a SIEM
- SIEM acts as the central investigation and correlation platform
EDR Telemetry
- Telemetry = detailed data collected by EDR agents from endpoints
- Acts as the "black box" of an endpoint for detection and investigation
- More telemetry = better ability to distinguish legitimate vs malicious activity
- Common types of collected telemetry:
- Process activity: executions, terminations, parent/child relationships
- Network connections: C2 traffic, unusual ports, lateral movement, exfiltration
- Command-line activity: CMD, PowerShell, scripts, obfuscated commands
- File & folder changes: malware drops, data staging, ransomware activity
- Registry modifications: configuration and persistence-related changes
- EDR uses logic and machine learning to analyze telemetry
- Advanced threats may look harmless individually, but correlated telemetry reveals malicious patterns
- Telemetry helps analysts:
- Reconstruct attack timelines
- Identify root cause
- Understand full chain of events
Detection & Response Capabilities
- Detection Techniques:
- Behavioral Detection:
- Analyzes how files/processes behave, not just signatures
- Flags unusual parent-child relationships
- Example: winword.exe spawning powershell.exe
- Anomaly Detection:
- Learns normal baseline behavior of endpoints
- Flags deviations from baseline
- May generate false positives, but provides rich context
- IOC Matching:
- Compares activity against known Indicators of Compromise from threat intel feeds
- Example: File hash matches a known malicious executable
- MITRE ATT&CK Mapping:
- Detected activity is mapped to tactic and technique
- Example: Creating scheduled task → Tactic: Persistence, Technique: Scheduled Task/Job
- Machine Learning:
- Detects complex and chained behaviors
- Useful for fileless and multi-stage attacks
- Behavioral Detection:
- Response Capabilities:
- Isolate Host: Disconnect endpoint from network to stop spread
- Terminate Process: Kill malicious process without isolating host
- Quarantine File: Move malicious file to isolated location for review or removal
- Remote Access (RTR):
- Analysts access endpoint shell remotely
- Run commands, scripts, and gather data
- Artifact Collection:
- Memory dumps
- Event logs
- Folder contents
- Registry hives
- Takeaway:
- EDR provides advanced detection beyond traditional antivirus
- Combines behavioral, anomaly, IOC, MITRE mapping, and ML techniques
- Enables both automated and analyst-driven response for effective containment and investigation
-
Room: Introduction to SIEM
What I Learned:
- The different types of log sources
- The limitations of working with isolated logs
- The importance of a SIEM solution
- The features of a SIEM solution
- Learned various types of log sources and their ingestion in the SIEM
- Process behind alerting and alert analysis
Logs Everywhere, Answers Nowhere: Log Sources in a Network
- All devices continuously generate logs (activity records)
- These devices are called log sources
- Logs are essential for detecting attacks and troubleshooting
- Two main categories:
- 1) Host-Centric Log Sources:
- Generated by endpoints and servers
- Examples: File access, Authentication attempts, Process execution, Registry changes, PowerShell execution
- 2) Network-Centric Log Sources:
- Generated when hosts communicate with each other or the internet
- Produced by firewalls, IDS/IPS, routers, etc.
- Examples: SSH connections, FTP file access, Web traffic, VPN access, Network file sharing
- 1) Host-Centric Log Sources:
- Challenges ("Answers Nowhere"):
- Numerous log sources: Hundreds of events per second from many devices
- No centralization: Logs live on individual machines. Requires connecting to each system separately
- Limited context: Single logs rarely tell the full story. Correlation across sources is required to see attack chains
- Limited manual analysis: Too many logs for humans to review individually
- Format differences: Logs come in many formats, increasing analysis complexity
Why SIEM?
- SIEM (Security Information and Event Management) collects logs from many log sources
- Logs are standardized, correlated, and analyzed
- Detects malicious activity using detection rules
- Centralized Log Collection:
- Collects logs from endpoints, servers, firewalls, etc.
- Uses lightweight agents or APIs
- Eliminates need to manually access each system
- Normalization of Logs:
- Different log formats are converted into a consistent format
- Logs are broken into fields (parsing)
- Converting all logs into one format is normalization
- Correlation of Logs:
- SIEM links related events across sources
- Helps identify malicious patterns
- Example correlated activity:
- Unusual VPN login
- File access
- PowerShell execution
- Outbound network connection
- Real-time Alerting:
- SIEM uses built-in and custom detection rules
- When rule conditions match, alerts are triggered
- Analysts investigate alerts inside SIEM
- Dashboards and Reporting:
- Present summarized, actionable insights
- Include default and custom dashboards
- Example dashboard data:
- Alert highlights
- System notifications
- Health alerts
- Failed login attempts
- Events ingested count
- Rules triggered
- Top domains visited
Log Sources & Ingestion
- Log Sources:
- Every device in a network generates logs whenever an activity occurs (user visits a website, connects via SSH, logs into a workstation, etc.)
- These devices are considered log sources
- Logs provide visibility into activity across the environment
- Logs from these sources are forwarded to a SIEM for centralized monitoring
- Windows Machines:
- Windows records events using Event Viewer
- Each event has a unique Event ID, making investigation and tracking easier
- Logs from Windows endpoints are forwarded to the SIEM
- Linux Machines:
- Linux stores events, errors, and warnings in various log files that are ingested into SIEM
- Common locations:
- /var/log/httpd – HTTP requests, responses, and errors
- /var/log/cron – Cron job activity
- /var/log/auth.log and /var/log/secure – Authentication logs
- /var/log/kern – Kernel-related events
- Web Servers:
- Important to monitor all inbound and outbound web traffic
- Apache logs commonly stored in:
- /var/log/apache
- /var/log/httpd
- Log Ingestion:
- SIEM solutions support multiple ingestion methods
- Once ingested, logs are parsed and normalized for analysis
- Agent / Forwarder:
- Lightweight tool installed on endpoints
- Collects and forwards logs to SIEM
- (Splunk calls this a forwarder.)
- Syslog:
- Widely used logging protocol
- Sends real-time logs from servers, databases, and devices to SIEM
- Manual Upload:
- Allows ingestion of offline log files
- Useful for quick or one-time analysis
- Port Forwarding:
- SIEM listens on a specific port
- Endpoints send logs directly to that port
Alerting Process and Analysis - Behind the Triggered Alerts
- SIEM detects threats by correlating logs and triggering alerts using detection rules
- Detection rules are logical expressions that define when an alert fires
- Purpose: timely detection so analysts can respond quickly
- Detection Rule Examples:
- 5 failed logins in 10 seconds → Multiple Failed Login Attempts
- Successful login after multiple failures → Successful Login After Multiple Login Attempts
- USB device plugged in → USB Activity Alert
- Outbound traffic > 25 MB → Potential Data Exfiltration
- How Rules Are Created:
- Based on field-value pairs from normalized logs
- Use-Case 1: Event Log Cleared
- Windows Event ID 104
- Rule: Log Source = WinEventLog AND EventID = 104 → Event Log Cleared
- Use-Case 2: WHOAMI Execution
- Process creation Event ID 4688
- Rule: Log Source = WinEventLog AND EventCode = 4688 AND NewProcessName contains whoami → WHOAMI Command Execution Detected
- Log normalization is critical for reliable rule matching
- Alert Investigation:
- Analysts monitor SIEM dashboards
- When alert triggers:
- Review events/flows
- Check rule conditions
- Determine True Positive vs False Positive
- Actions After Analysis:
- False Positive: Tune rule
- True Positive:
- Further investigation
- Contact asset owner
- If confirmed malicious:
- Isolate host
- Block IP
-
LAB: Splunk The Basics
Splunk Components
- Splunk has three main components:
- Forwarder
- Indexer
- Search Head
- These components work together to collect, process, store, and analyze logs
- Splunk Forwarder:
- Lightweight agent installed on endpoints
- Collects data and sends it to the Splunk Indexer
- Uses minimal system resources
- Common data sources:
- Web server logs (web traffic)
- Windows logs (Event Logs, PowerShell, Sysmon)
- Linux host logs
- Database logs (connections, responses, errors)
- Splunk Indexer:
- Core processing component
- Receives data from forwarders
- Parses and normalizes data into field-value pairs
- Categorizes and stores data as events
- Makes data searchable
- Splunk Search Head:
- Interface where users search and analyze data
- Uses SPL (Search Processing Language)
- Sends search requests to indexers
- Indexers return matching events as field-value pairs
- Can create tables and visualizations (pie charts, bar charts, column charts)
Lab - Ingesting & Analyzing VPN Logs in Splunk
- Ingested VPN log file into Splunk using the Upload option
- Created a custom index named VPN_Logs
- Confirmed data was processed into individual searchable events
- Actions Performed:
- Opened Add Data from Splunk home screen
- Selected Upload to ingest local file
- Uploaded VPN_logs file
- Selected appropriate source type
- Set Index = VPN_Logs
- Assigned a hostname
- Completed ingestion and verified logs were searchable
- Searches & Analysis Performed:
- Ran SPL queries to answer lab questions:
- Counted total number of events in the log file
- Filtered events for user Maleena and counted matching logs
- Identified username associated with IP 107.14.182.38
- Calculated number of events from all countries except France
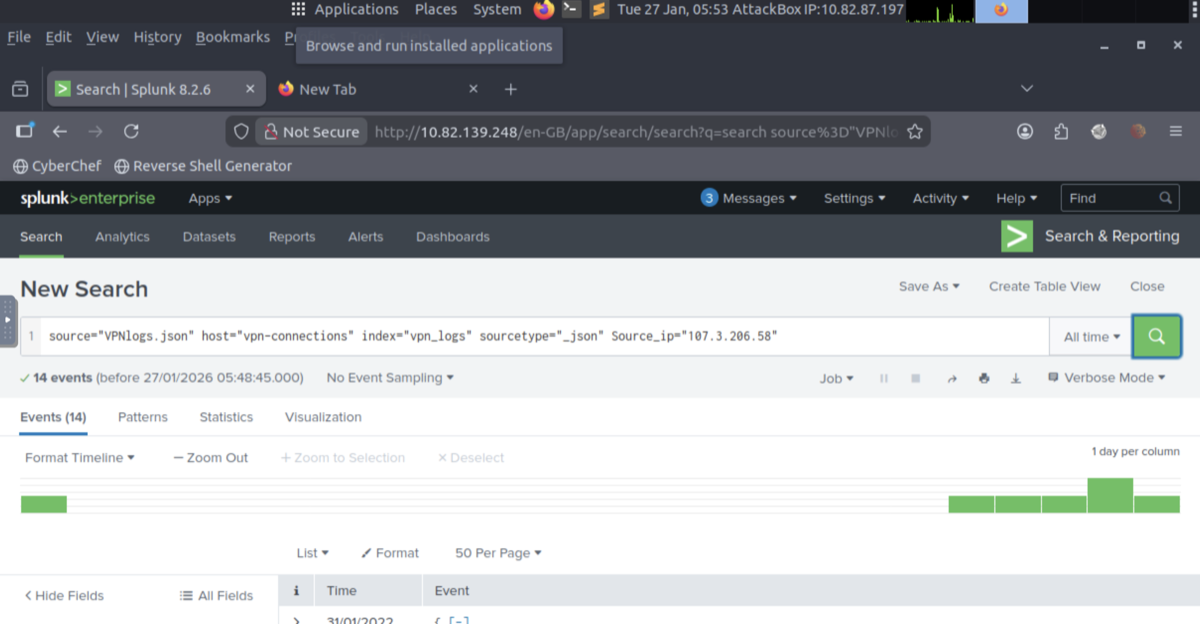
- Counted number of VPN events associated with IP 107.3.206.58
- Ran SPL queries to answer lab questions:
- Skills Practiced:
- Creating custom indexes
- Uploaded and ingested log data
- Used SPL to:
- Filtered by fields (username, IP, country)
- Counted events
- Investigated VPN activity
- Splunk has three main components:
-
Room: Elastic Stack: The Basics
Elastic Stack Overview
- 1) Elasticsearch:
- Full-text search and analytics engine for JSON documents
- Stores, analyzes, and correlates data
- Provides a RESTful API for interaction
- 2) Logstash:
- Data processing pipeline that:
- Ingests from many sources
- Filters, parses, and normalizes data
- Sends data to destinations (Elasticsearch, Kibana, ports, files)
- Logstash config has 3 sections:
- Input: Data source
- Filter: Parsing and normalization rules
- Output: Where data is sent
- Supports many input, output, and filter plugins
- Data processing pipeline that:
- 3) Beats:
- Host-based data shippers (agents) that send endpoint data to Elasticsearch
- Each Beat is single-purpose and collects a specific type of data
- Examples: Winlogbeat (Windows logs), Packetbeat (network flows)
- 4) Kibana:
- Web-based visualization and investigation tool for Elasticsearch data
- Used to create visualizations and dashboards for real-time visibility
- How They Work Together (Flow):
- Beats collect endpoint data (for example, Winlogbeat and Packetbeat)
- Logstash ingests from beats, ports, or files → parses and normalizes into field-value pairs → sends to Elasticsearch
- Elasticsearch stores data and enables search and analysis
- Kibana visualizes and investigates data stored in Elasticsearch (charts, dashboards, timelines, infographics)
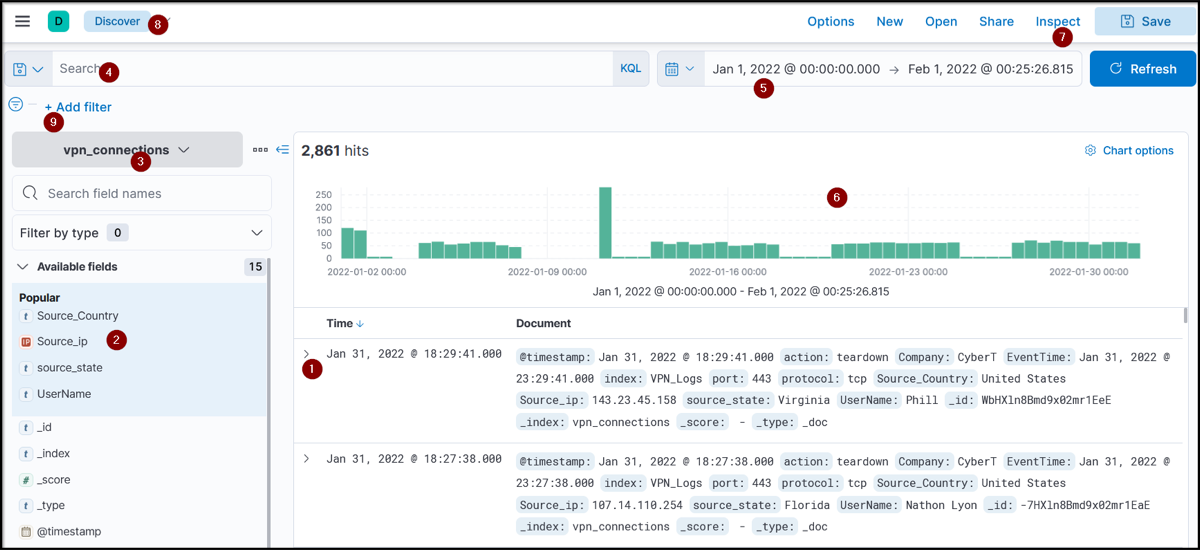
Discover Tab
- Kibana supports front-end interaction with Elasticsearch data
- Discover tab is the primary workspace for SOC analysts
- Used to explore, search, filter, and analyze raw logs
- Main Elements of the Discover Tab:
- Logs: Each row = one log event. Shows event details with associated fields and values
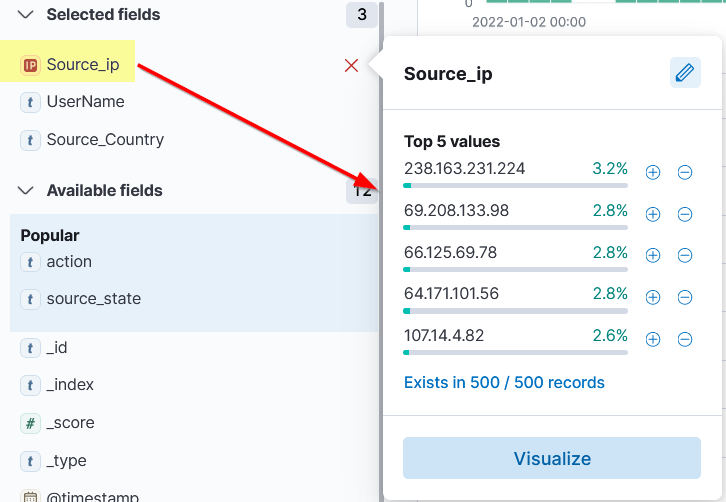
- Fields Pane: Left-side panel listing parsed/normalized fields. Clicking a field shows top 5 values and percentage. + adds filter (include value). – adds filter (exclude value)
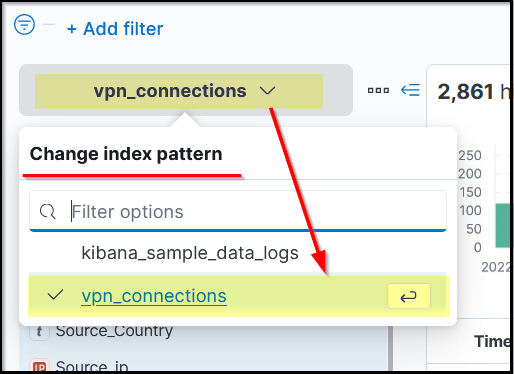
- Index Pattern: Determines which data set Kibana searches. Each log source has its own index pattern. One index pattern can map to multiple indices. Lab uses index pattern: vpn_connections
- Search Bar: Enter queries and apply filters
- Time Filter: Filter logs by specific time ranges
- Timeline (Time Interval): Bar chart showing event counts over time. Clicking a bar shows logs for that period. Helps identify log spikes or anomalies
- Top Bar: Save searches, open saved searches, share, or save results
- Add Filter: Apply filters to fields without writing full queries
- Index Pattern (Details):
- Required for Kibana to access Elasticsearch data
- Defines how logs are normalized into fields and values
- Created per data source based on log structure
- Fields Pane (Details):
- Shows normalized fields detected in logs
- Used to quickly build filters
- Filters can also be added using Add Filter under the search bar
- Create Table:
- Logs appear raw by default
- Analysts can select specific fields from a log to create a table view
- Reduces noise and improves readability
- Tables can be saved and reused later
- LAB: Kibana Discover skills exercise: Performed index selection, time filtering, field filtering, spike analysis, and table creation
KQL Overview - KQL (Kibana Query Language)
- KQL is used in Kibana's search bar to query logs stored in Elasticsearch
- Supports two main search types:
- Free text search
- Field-based search
- Free Text Search:
- Searches for a term across all fields
- Example: United States
- Returns all logs containing the term anywhere
- Wildcards:
- * matches partial words
- Example: United*
- Matches United, United States, United Nations, etc.
- Logical Operators:
- AND: Returns logs containing both terms
- Example: "United States" AND "Virginia"
- OR: Returns logs containing either term
- Example: "United States" OR "England"
- NOT: Excludes a term, include all from United States except Florida
- Example: "United States" AND NOT ("Florida")
- AND: Returns logs containing both terms
- Field-Based Search:
- Syntax: Field : Value
- Searches within a specific field
- Example: Source_ip : 238.163.231.224 AND UserName : Suleman
- Returns logs where:
- Source_ip = 238.163.231.224
- UserName = Suleman
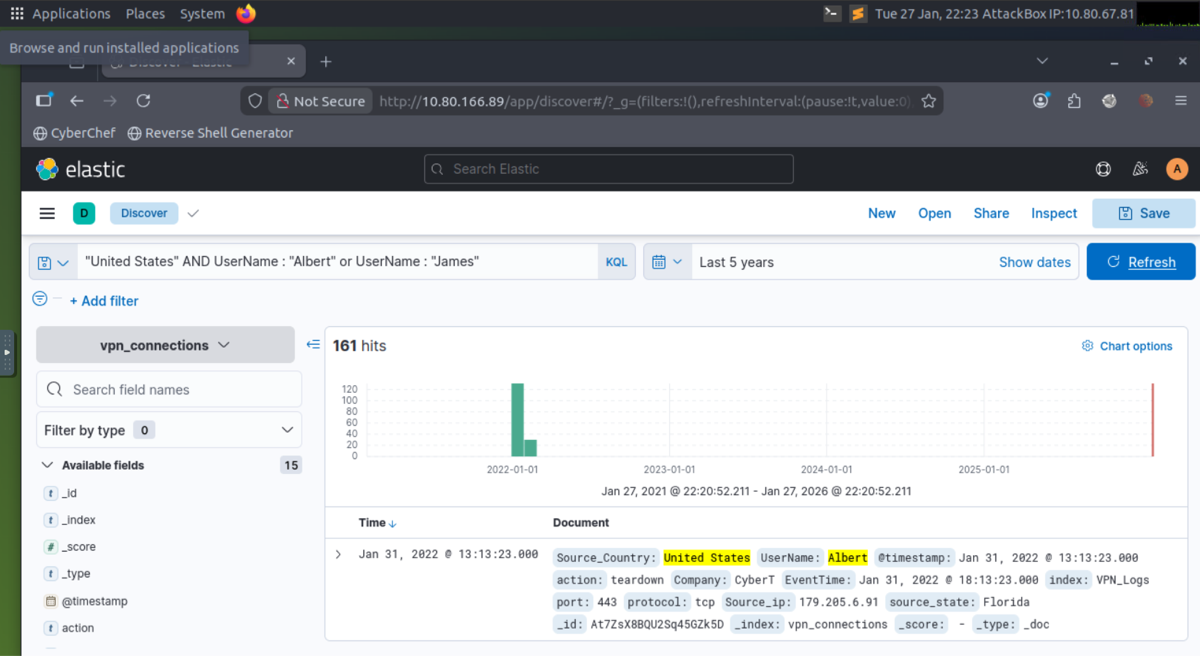
- LAB: Created a search query to filter "United States and show logs from users James or Albert, screenshot below:
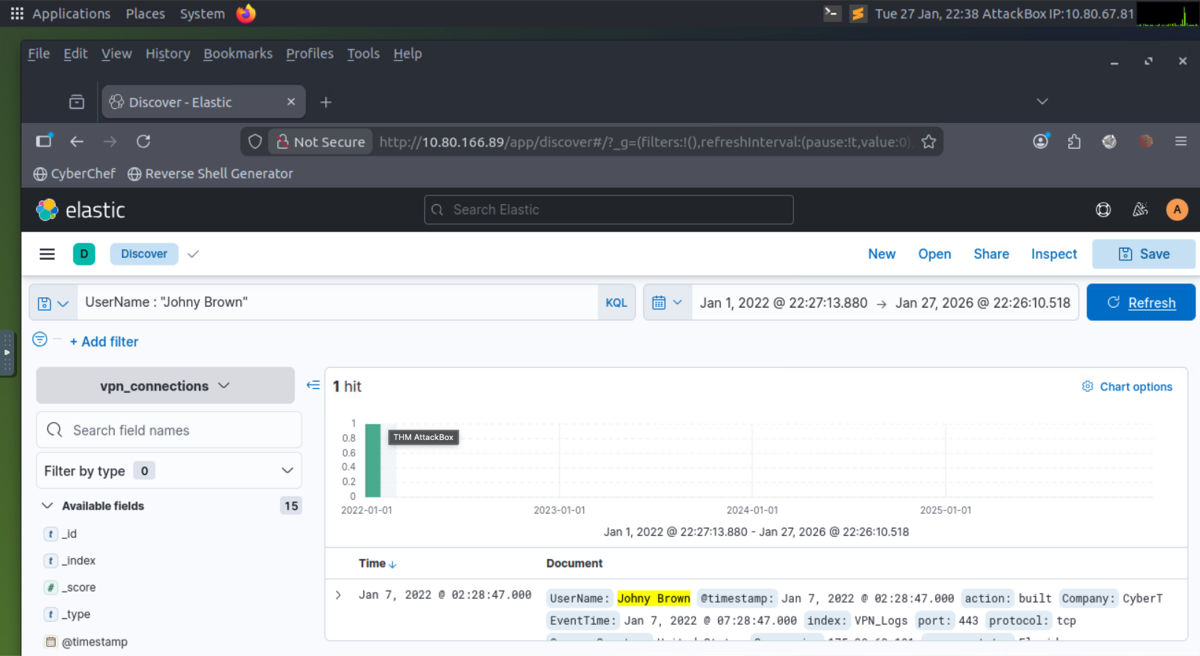
- LAB: A user was terminated on January 1, 2022, created a search query to determine how many times a VPN connection was observed after his termination.
- 1) Elasticsearch:
-
Room: Introduction to SOAR
Traditional SOC and Challenges
- How Traditional SOCs Work:
- A Security Operations Center (SOC) is a centralized function for monitoring and protecting digital assets
- SOCs enhance incident handling through continuous monitoring and analysis
- Built on people, processes, and technology aligned with business goals
- Key SOC Capabilities:
- Monitoring and Detection:
- Continuous scanning for suspicious activity
- Primarily performed using SIEM
- Examples: Multiple failed login attempts, Login from unknown location
- Recovery and Remediation:
- SOC acts as first responder during incidents
- Actions include: Isolating or shutting down infected endpoints, Removing malware, Stopping malicious processes
- Uses tools such as EDR, firewalls, IAM, etc.
- Examples: Isolate endpoint via EDR, Block IP on firewall, Disable user in IAM
- Threat Intelligence:
- Uses continuous feeds of IPs, hashes, domains, and other IOCs
- Example: Block malicious domain from TI feed
- Communication:
- Coordinates with IT teams and management
- Example: Create ticket for IT to verify a patch
- Monitoring and Detection:
- Challenges Faced by SOCs:
- Alert Fatigue:
- Large volume of alerts from many tools
- Many are false positives or low-quality
- Too Many Disconnected Tools:
- Tools deployed without integration
- Analysts must pivot between multiple consoles
- Manual Processes:
- Procedures not well documented
- Heavy reliance on tribal knowledge
- Slower investigations and response
- Talent Shortage:
- Difficulty hiring skilled analysts
- Alert overload + staff shortage → burnout
- Leads to longer response times and higher risk
- Alert Fatigue:
Overcoming SOC Challenges with SOAR
- What is SOAR?
- SOAR (Security Orchestration, Automation, and Response) unifies security tools used in a SOC
- Analysts can operate SIEM, EDR, Firewall, IAM, TI platforms, etc. from a single interface
- Provides ticketing and case management for documenting, tracking, and resolving incidents
- Core Capabilities of SOAR:
- 1) Orchestration:
- Coordinates multiple security tools within SOAR
- Eliminates manual switching between tools
- Uses predefined workflows called playbooks
- Playbooks define step-by-step investigation logic
- Example (VPN Brute Force Playbook):
- Receive alert from SIEM
- Query SIEM for user's normal login behavior
- Check TI platforms for IP reputation
- Query SIEM for successful logins
- Escalate to containment actions
- Playbooks are dynamic. Results of one step determine next action. May stop early if activity is benign
- 2) Automation:
- Playbooks are executed automatically
- No manual analyst clicks required
- Example Automation Flow:
- Receive SIEM alert
- Automatically query SIEM for historical logins
- Automatically check IP reputation
- If IP malicious → disable user in IAM
- Automatically open ticket with details
- Allows analysts to handle large alert volumes efficiently
- 3) Response:
- Enables and automates response actions from one interface
- Examples: Block IP on firewall, Disable user in IAM, Open ticket
- 1) Orchestration:
- Do We Still Need SOC Analysts?
- Yes. SOAR does not replace analysts
- Analysts handle:
- Complex investigations
- Judgment calls
- Playbook creation and tuning
- Business-context decisions
- SOAR reduces burden by automating repetitive tasks and organizing workflows
Building SOAR Playbooks
- Phishing Playbook:
- Phishing is the most common attack vector
- Manual phishing investigations are time-consuming (URLs, attachments, TI lookups)
- SOAR can execute these tasks in the background using a playbook
- Remediation can be performed automatically when phishing is confirmed
- Typical Phishing Playbook Flow:
- Receive alert: Suspicious email received
- Create ticket
- Check if email contains:
- URL
- Attachment
- If no URL or attachment → notify user
- If URL present → analyze URL (sandbox / TI lookup)
- If attachment present → analyze attachment (sandbox / malware scan)
- Based on results:
- Malicious → remediate (block, quarantine, delete email, etc.)
- Benign → close ticket
- Playbooks rely on conditional logic: "If this happens → do this; else → do that"
- CVE Patching Playbook (Exam Style):
- CVE = publicly disclosed vulnerability with assigned ID
- SOC must:
- Track newly released CVEs
- Verify if vulnerable systems exist internally
- Patch affected systems
- Challenges:
- High volume of CVEs
- Time-consuming manual process
- Backlogs lead to unpatched systems
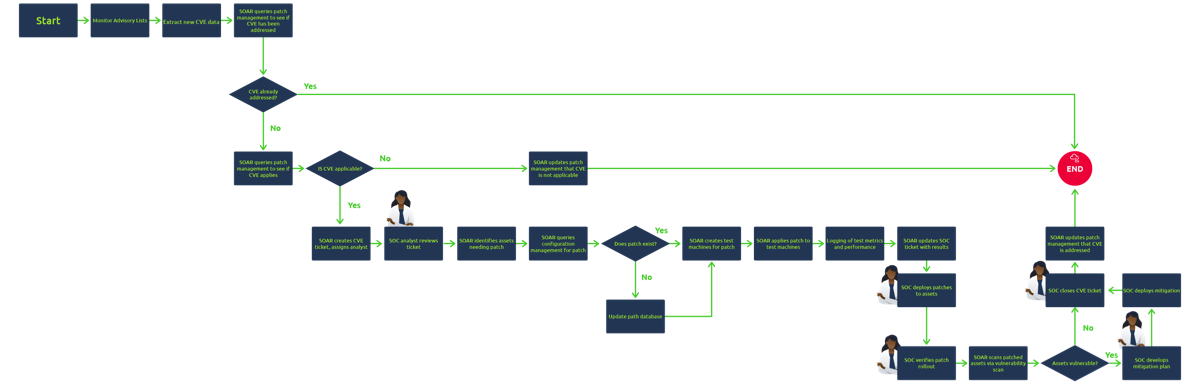
- Typical CVE Patching Playbook Flow:
- Ingest CVE details
- Analyze severity and risk threshold
- Check if vulnerable systems exist
- Create patching ticket
- Test patch
- Push patch to production
- Analyst Involvement:
- Most steps are automated
- SOC analysts remain involved at key decision points
- SOAR reduces manual workload but does not replace analysts
- How Traditional SOCs Work:
Section 4: Cyber Defense Frameworks
Pyramid of Pain, Cyber Kill Chain, and MITRE, helps understand adversarial behaviour and harden detection, triage, and response.
-
Room: Cyber Defense Frameworks
Hash Values (Trivial) - Hash Values & Hashing Algorithms
- Hash value = fixed-length numeric value that uniquely identifies data
- Generated by a hashing algorithm
- If two files share the same hash, the hash function is not cryptographically secure
- Used by security professionals to:
- Identify malware samples
- Reference malicious/suspicious files
- Share IOCs in reports
- Common Hashing Algorithms:
- MD5:
- 128-bit hash
- Designed by Ron Rivest (1992)
- Not cryptographically secure
- Vulnerable to hash collisions
- RFC 6151 documents MD5 weaknesses
- SHA-1:
- 160-bit hash (40 hex characters)
- Invented by NSA (1995)
- Deprecated by NIST in 2011
- Banned for digital signatures in 2013
- Susceptible to brute-force attacks
- NIST recommends migrating to SHA-2 or SHA-3
- SHA-2 (e.g., SHA-256):
- Designed by NIST & NSA (2001)
- Replacement for SHA-1
- SHA-256 produces 256-bit hash (64 hex characters)
- Widely used and considered secure
- MD5:
- Hashes in Threat Intelligence:
- Ransomware and malware reports often include file hashes
- Example sources: The DFIR Report, Trellix Threat Research Blogs
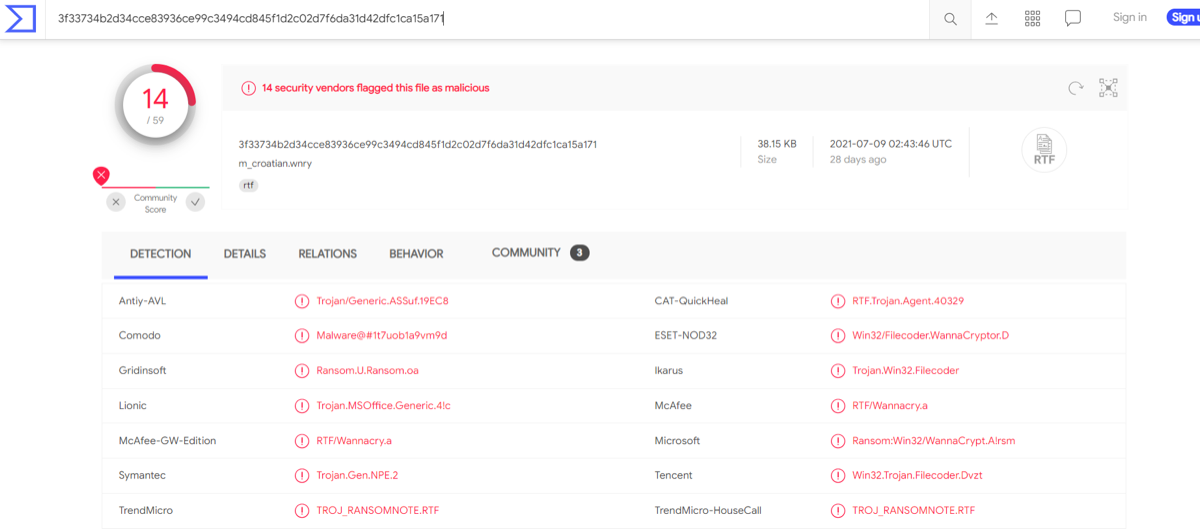
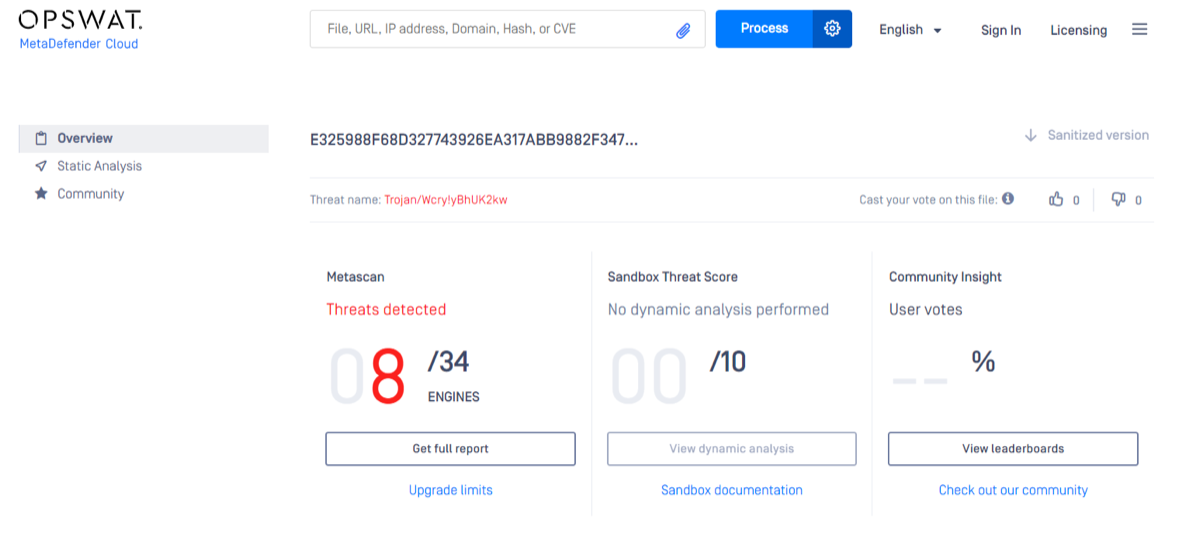
- Hash Lookup Tools:
- VirusTotal
- MetaDefender Cloud (OPSWAT)
- Hash lookups can reveal: File name, Malware classification, Detection results
- Limitations of Hash-Based IOCs:
- Attackers can change a file by one bit → completely new hash
- Easy to evade hash-based detection
- Many malware variants exist
- Hashes alone are weak IOCs for long-term threat hunting
- File Hash Modification Example (Concept):
- Appending data (e.g., using echo) to a file changes its hash
- Demonstrates how trivial it is to evade hash-based detection
IP Address (Easy) - IP Addresses as Indicators
- An IP address identifies any device connected to a network (desktops, servers, CCTV cameras, etc.).
- Used to send and receive data across networks.
- In the Pyramid of Pain, IP addresses are in the green level (easy for attackers to change).
- Defensive Use of IP Addresses:
- Knowing adversary IPs is useful for defense.
- Common tactic: Block / drop / deny traffic from malicious IPs at perimeter or external firewalls.
- Limitation: Attackers can easily switch to a new public IP.
- Fast Flux:
- Technique used by adversaries to evade IP-based blocking.
- According to Akamai: Fast Flux is a DNS technique used by botnets; it hides phishing, malware delivery, proxying, and C2 communications behind compromised hosts.
- Purpose: Make malware ↔ C2 communication harder to detect.
- Core concept: Multiple IP addresses mapped to one domain; IPs constantly change.
- Reference Reading:
- Palo Alto Networks created a great fictional scenario to explain Fast Flux: Fast Flux 101: How Cybercriminals Improve the Resilience of Their Infrastructure to Evade Detection and Law Enforcement Takedowns
Domain Names (Simple) - Domain Names as Indicators
- Domain names map an IP address to a human-readable string.
- Common formats:
- Domain + TLD:
evilcorp.com - Subdomain + domain + TLD:
tryhackme.evilcorp.com
- Domain + TLD:
- Domain Names & Attacker Effort:
- Harder to change than IPs because attackers must:
- Purchase a domain
- Register it
- Modify DNS records
- Many DNS providers have loose standards and offer APIs, which can make domain changes easier for attackers.
- Harder to change than IPs because attackers must:
- Punycode:
- According to Jamf, Punycode is a way of converting words that cannot be written in ASCII into a Unicode ASCII encoding.
- Example:
adıdas.de→ Punycode:http://xn--addas-o4a.de/ - Modern browsers (Chrome, Edge, Safari, IE) translate Punycode automatically.
- Detecting Malicious Domains:
- Use proxy logs and web server logs to identify suspicious domain activity.
- URL Shorteners Used by Attackers:
- Attackers often hide malicious domains behind short URLs.
- Common services:
bit.ly,goo.gl,ow.ly,s.id,smarturl.it,tiny.pl,tinyurl.com,x.co
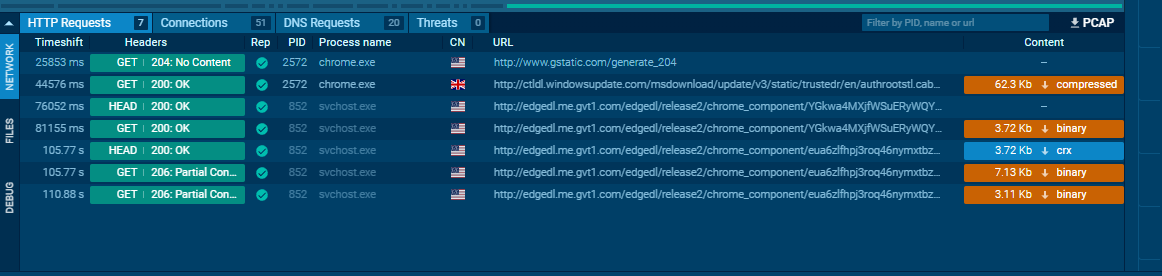
- Viewing Connections in Any.run:
- Any.run is a sandboxing service that executes malware samples.
- Use the Networking tab to view activity.
- Be extremely cautious about visiting any listed IPs or URLs.
- HTTP Requests:
- Show resources retrieved from web servers.
- Useful for identifying droppers, downloaders, or callback URLs.
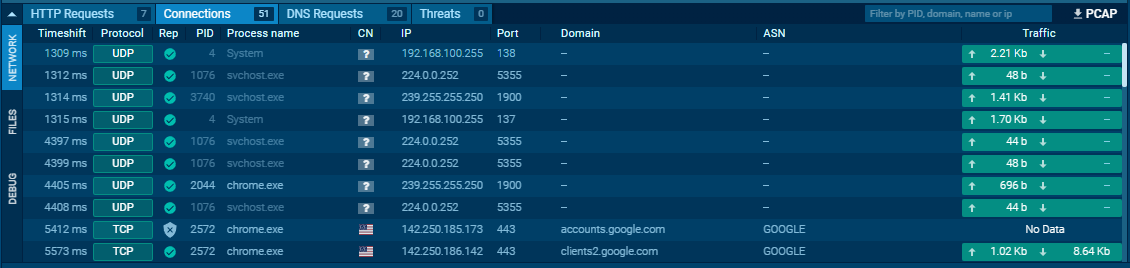
- Connections:
- Show host-to-host communications.
- Useful for spotting C2 traffic, FTP uploads/downloads, and other suspicious channels.
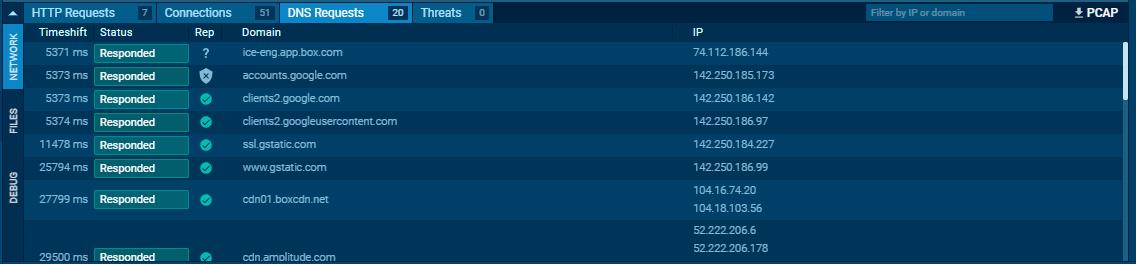
- DNS Requests:
- Show domains queried by malware.
- Malware may use DNS requests to check internet connectivity.
- Failure to reach the internet may indicate sandboxing or containment.
Host Artifacts (Annoying)
- At this level of the Pyramid of Pain, the attacker will feel more annoyed and frustrated if detected.
- The attacker must circle back and change tools and methodologies, which is time-consuming and requires more resources.
- Host artifacts are traces or observables left on a system by attackers, such as:
- Registry values
- Suspicious process execution
- Attack patterns
- IOCs (Indicators of Compromise)
- Files dropped or modified by malicious applications
- Anything exclusive to the current threat
- Examples:
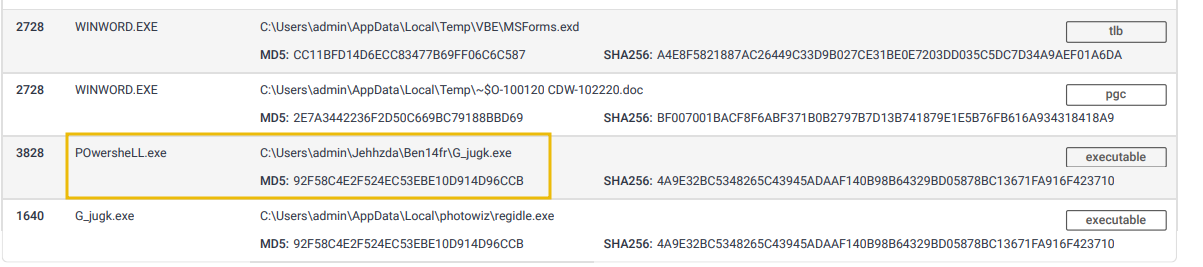
- Suspicious process execution from Word:

- Suspicious events followed by opening a malicious application:
- Files modified or dropped by the malicious actor:
Network Artifacts (Annoying)
- Network artifacts belong to the yellow zone in the Pyramid of Pain.
- Detection at this level causes more pain for attackers than hashes or IP addresses.
- Attackers must spend more time modifying tools or tactics.
- Gives defenders more time to respond, detect new threats, and remediate existing ones.
- What are network artifacts?
- Indicators observable in network traffic, such as:
- User-Agent strings
- C2 (Command and Control) information
- URI patterns
- HTTP POST request patterns
- Indicators observable in network traffic, such as:
- User-Agent strings:
- Defined in RFC 2616.
- Request-header field containing information about the user agent making the request.
- Can be suspicious if:
- Never seen before in your environment
- Looks abnormal or out of place compared to typical traffic
- Where network artifacts are detected:
- Wireshark PCAPs
- Network protocol analyzers (e.g., TShark)
- IDS logs (e.g., Snort)
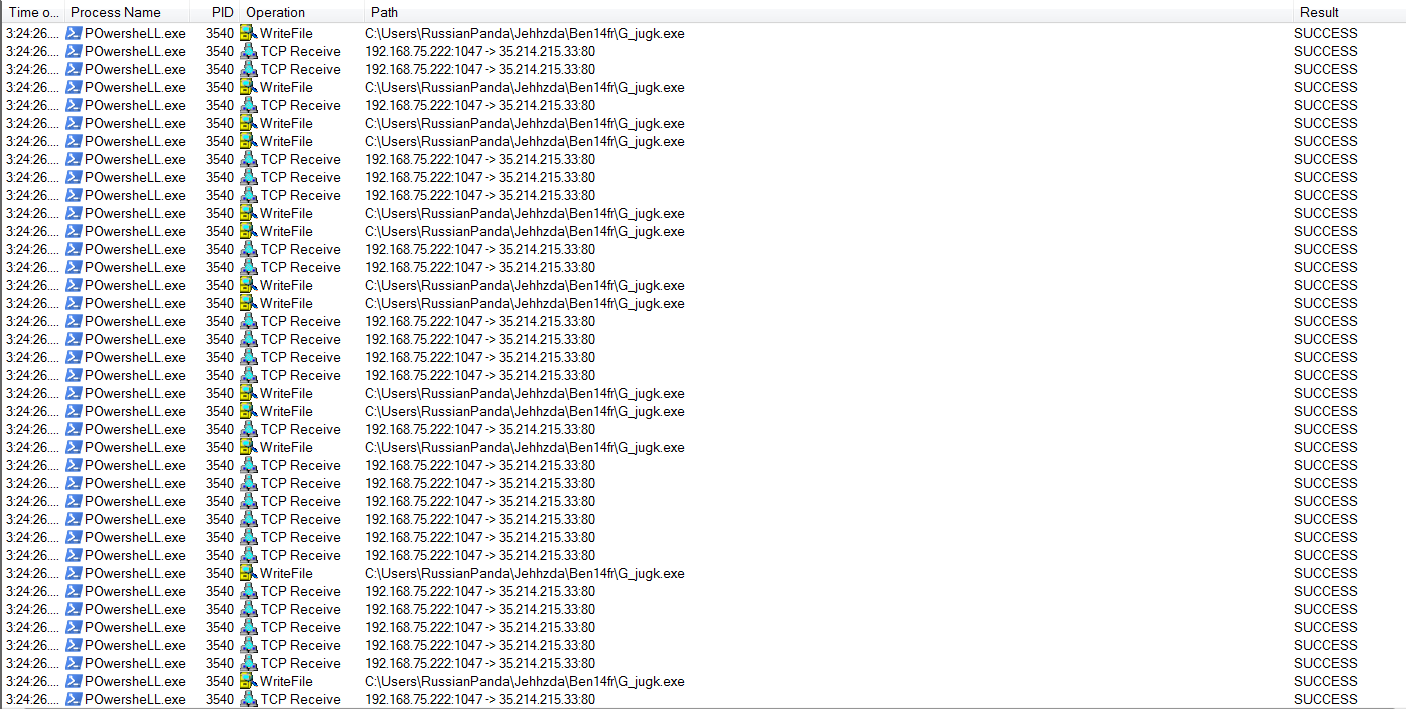
- Example: HTTP POST requests containing suspicious strings:

Tools (Challenging)
- At this stage of the Pyramid of Pain, defenders have leveled up detection capabilities beyond simple artifacts.
- Attackers are often forced to either:
- Abandon the attack, or
- Build or find new tools that serve the same purpose.
- This requires:
- More time
- More money
- Additional training or skill
- Detection at this level can be game over for many attackers.
- How attackers use tools:
- Create malicious macro documents (maldocs) for spearphishing campaigns.
- Deploy backdoors to establish C2 (Command and Control) infrastructure.
- Build or use:
- Custom
.exeand.dllfiles - Payloads
- Password crackers
- Custom
- Defensive capabilities at this level:
- Antivirus signatures
- Detection rules (e.g., SIEM or EDR rules)
- YARA rules for hunting and classifying malware families.
- Useful resources for defenders:
- MalwareBazaar and Malshare — provide malware samples, malicious feeds, and YARA results.
- SOC Prime Threat Detection Marketplace — community-shared detection rules, including detections for the latest exploited CVEs.
- Fuzzy hashing:
- Used for similarity analysis to match files with minor differences.
- Example tool: SSDeep.
- Helps detect malware variants that evade traditional hash-based detection.
- The official SSDeep documentation provides a detailed explanation of fuzzy hashing and similarity scores.
TTPs (Tough) - Tactics, Techniques & Procedures
- TTPs stands for Tactics, Techniques, and Procedures.
- Represents the entire MITRE ATT&CK Matrix.
- Covers all adversary actions from:
- Initial phishing
- Persistence
- Lateral movement
- Data exfiltration
- Why detecting TTPs matters:
- Detecting and responding to TTPs quickly leaves attackers little chance to succeed.
- Example: Detect Pass-the-Hash via Windows Event Log monitoring, identify the compromised host, and stop lateral movement.
-
Room: Cyber Kill Chain
Intro - Cyber Kill Chain Overview
- Kill chain concept: Originates from the military, describing stages of an attack — identify target, decide to attack, destroy target.
- Cyber Kill Chain®: Created by Lockheed Martin in 2011 to describe how adversaries conduct cyberattacks.
- For an attack to succeed, the adversary must progress through all phases of the kill chain.
- Why it matters:
- Helps understand and defend against ransomware, security breaches, and APTs.
- Used to assess security posture, identify missing controls, and close gaps based on current infrastructure.
- Useful for SOC analysts, security researchers, threat hunters, and incident responders.
- Enables defenders to recognize intrusion attempts and understand attacker goals and objectives.
- Cyber Kill Chain phases:
- Reconnaissance
- Weaponization
- Delivery
- Exploitation
- Installation
- Command & Control
- Actions on Objectives
Reconnaissance
- Reconnaissance is the research and planning phase of an attack.
- Adversaries gather information to inform next steps.
- Information may include:
- Infrastructure details
- Employee data
- Business processes
- Exposed technologies
- Recon is often passive and undetected.
- Poor recon → sloppy attacks; strong recon → targeted, believable payloads and higher success.
- OSINT (Open-Source Intelligence):
- Collection of intelligence from publicly available sources.
- Common sources: Search engines, print and online media, social media, online forums and blogs, public record databases, WHOIS and technical data.
- Additional resources: TryHackMe OSINT Room; Varonis article What is OSINT?
- Reconnaissance types:
- Passive recon: No direct interaction with target (e.g., WHOIS lookups, social media scraping, reviewing breach data).
- Active recon: Direct interaction with target (e.g., social engineering, port scanning, banner grabbing, probing for open services).
- Email harvesting: Process of collecting email addresses from public/paid/free sources to support phishing attacks.
- Common tools:
- theHarvester — gathers emails, names, subdomains, IPs, and URLs.
- Hunter.io — finds contact information tied to a domain.
- OSINT Framework — collection of OSINT tools organized by category.