Phase 1 — Deploy Elastic Security Infrastructure
- Created a dedicated Ubuntu Server VM in Parallels for Elastic SIEM
- Installed Elasticsearch
- Installed and configured Kibana
- Confirmed dashboard access via browser
Step 1: Prep the System
sudo apt update
sudo apt upgrade -y
sudo apt install -y curl apt-transport-https ca-certificates gnupg
Step 2: Add Elastic GPG Key
curl -fsSL https://artifacts.elastic.co/GPG-KEY-elasticsearch | \
sudo gpg --dearmor -o /usr/share/keyrings/elastic-keyring.gpg
Step 3: Add Elastic APT Repository
echo "deb [signed-by=/usr/share/keyrings/elastic-keyring.gpg] https://artifacts.elastic.co/packages/8.x/apt stable main" | \
sudo tee /etc/apt/sources.list.d/elastic-8.x.list
Step 4: Update Repository List
sudo apt updateStep 5: Install Elasticsearch
sudo apt install -y elasticsearchStep 6: Enable and Start Elasticsearch
sudo systemctl daemon-reload
sudo systemctl enable elasticsearch
sudo systemctl start elasticsearch
Step 7: Verify Elasticsearch
sudo systemctl status elasticsearchStep 8: Generate / Reset Elastic Password
sudo /usr/share/elasticsearch/bin/elasticsearch-reset-password -u elasticStep 9: Install Kibana
sudo apt install -y kibanaStep 10: Enable & Start Kibana
sudo systemctl enable kibana
sudo systemctl start kibana
Step 11: Verify Kibana Running
sudo systemctl status kibanaStep 12: Allow remote access to Kibana
sudo nano /etc/kibana/kibana.ymlEdit the localhost line #server.host: "localhost" and replace it with server.host: "0.0.0.0". Note to remove the # sign to uncomment the line.
Step 13: Generate Kibana Enrollment Token
sudo /usr/share/elasticsearch/bin/elasticsearch-create-enrollment-token -s kibanaPaste the token into Browser
Step 14: Get the Kibana Verification Code
sudo /usr/share/kibana/bin/kibana-verification-codeStep 15: Access Kibana Dashboard
https://<KIBANA_VM_IP>:5601Phase 2 — Endpoint Telemetry Creation
In this phase, I focused on getting real endpoint data into my SIEM and making sure I could actually see and understand what was happening on a system.
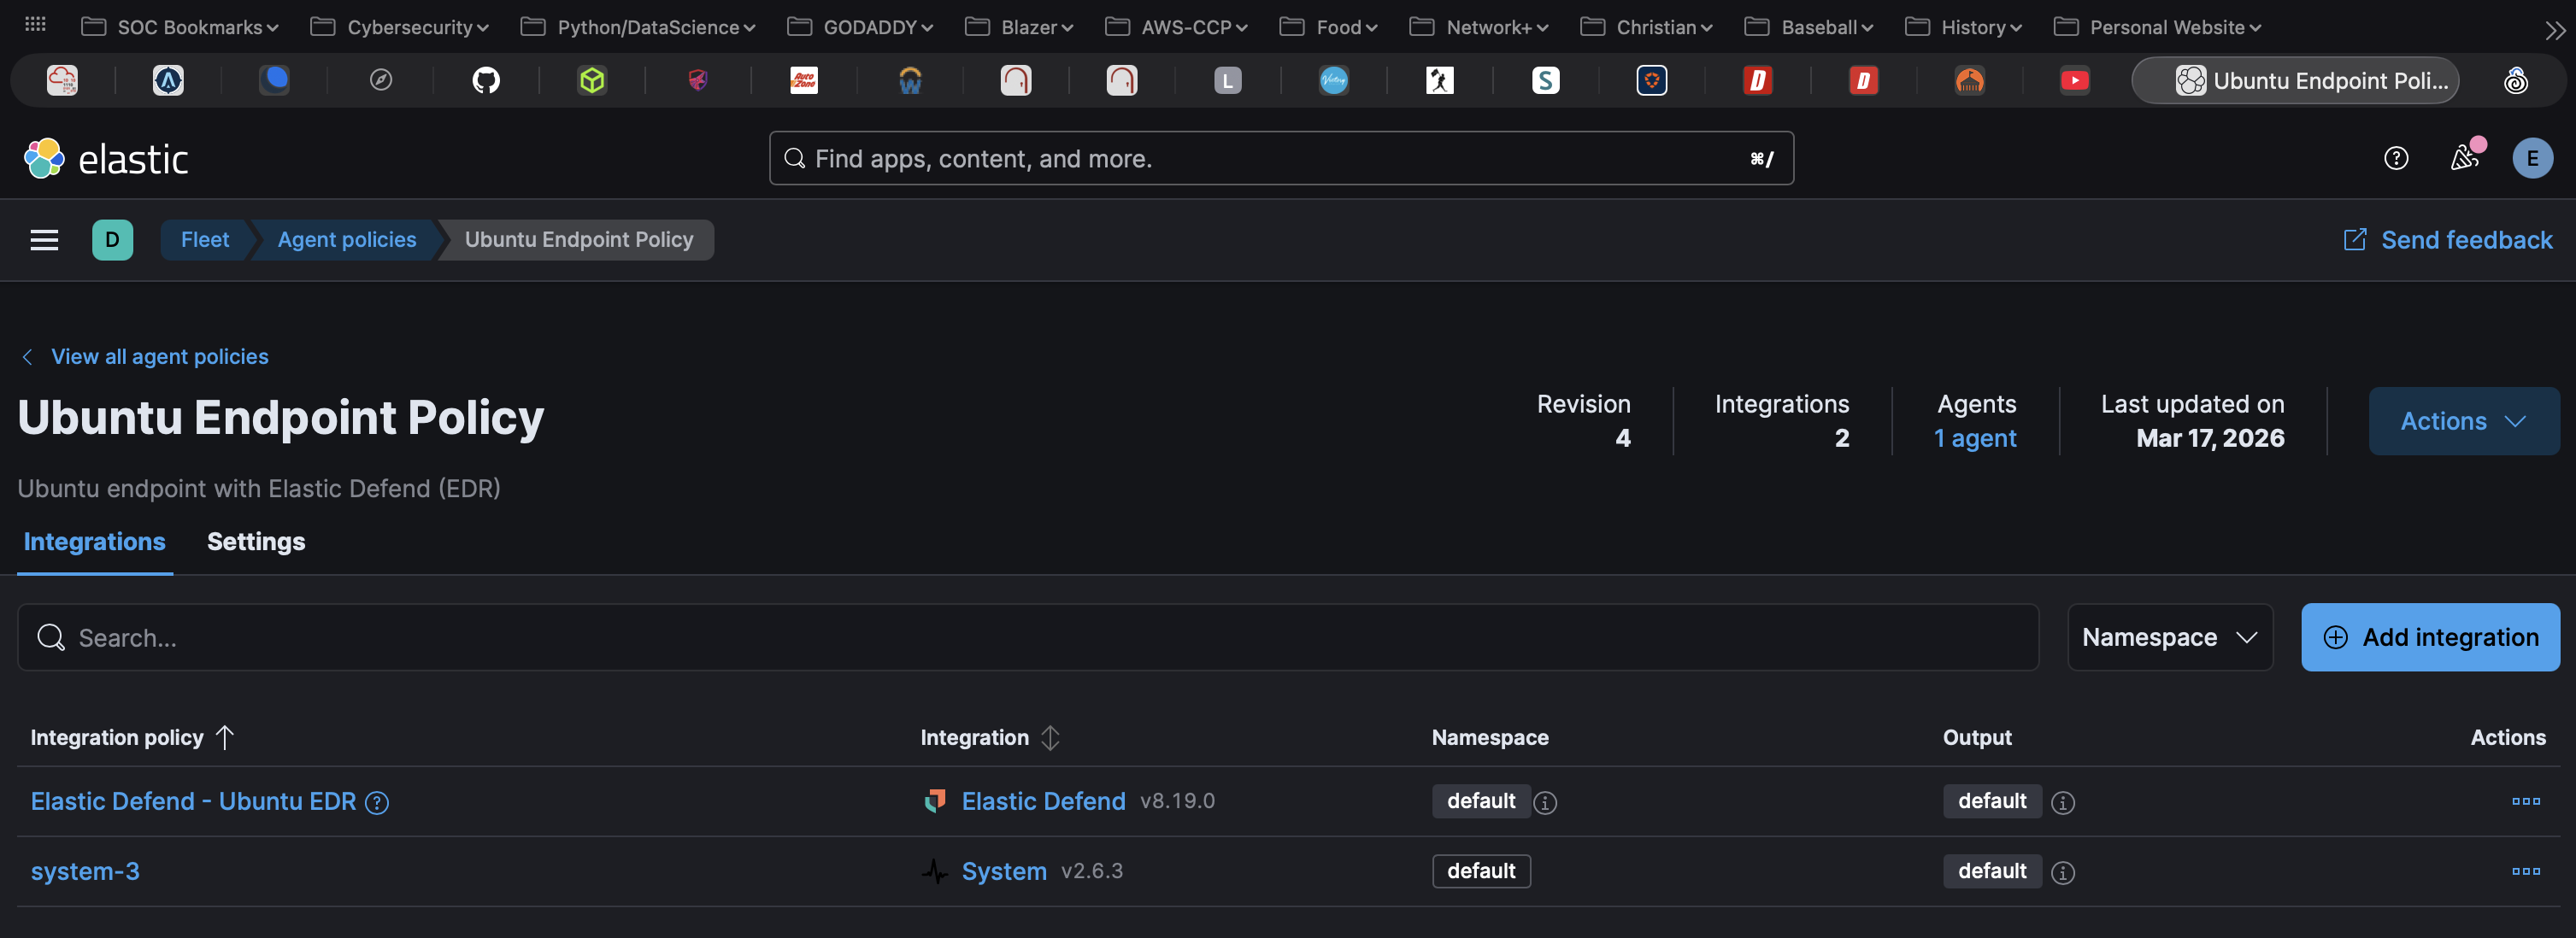
I deployed the Elastic Agent on an Ubuntu Desktop endpoint and enrolled it into my Elastic Fleet environment. From there, I applied an Elastic Defend policy to begin collecting endpoint telemetry such as process activity, file changes, and network events.
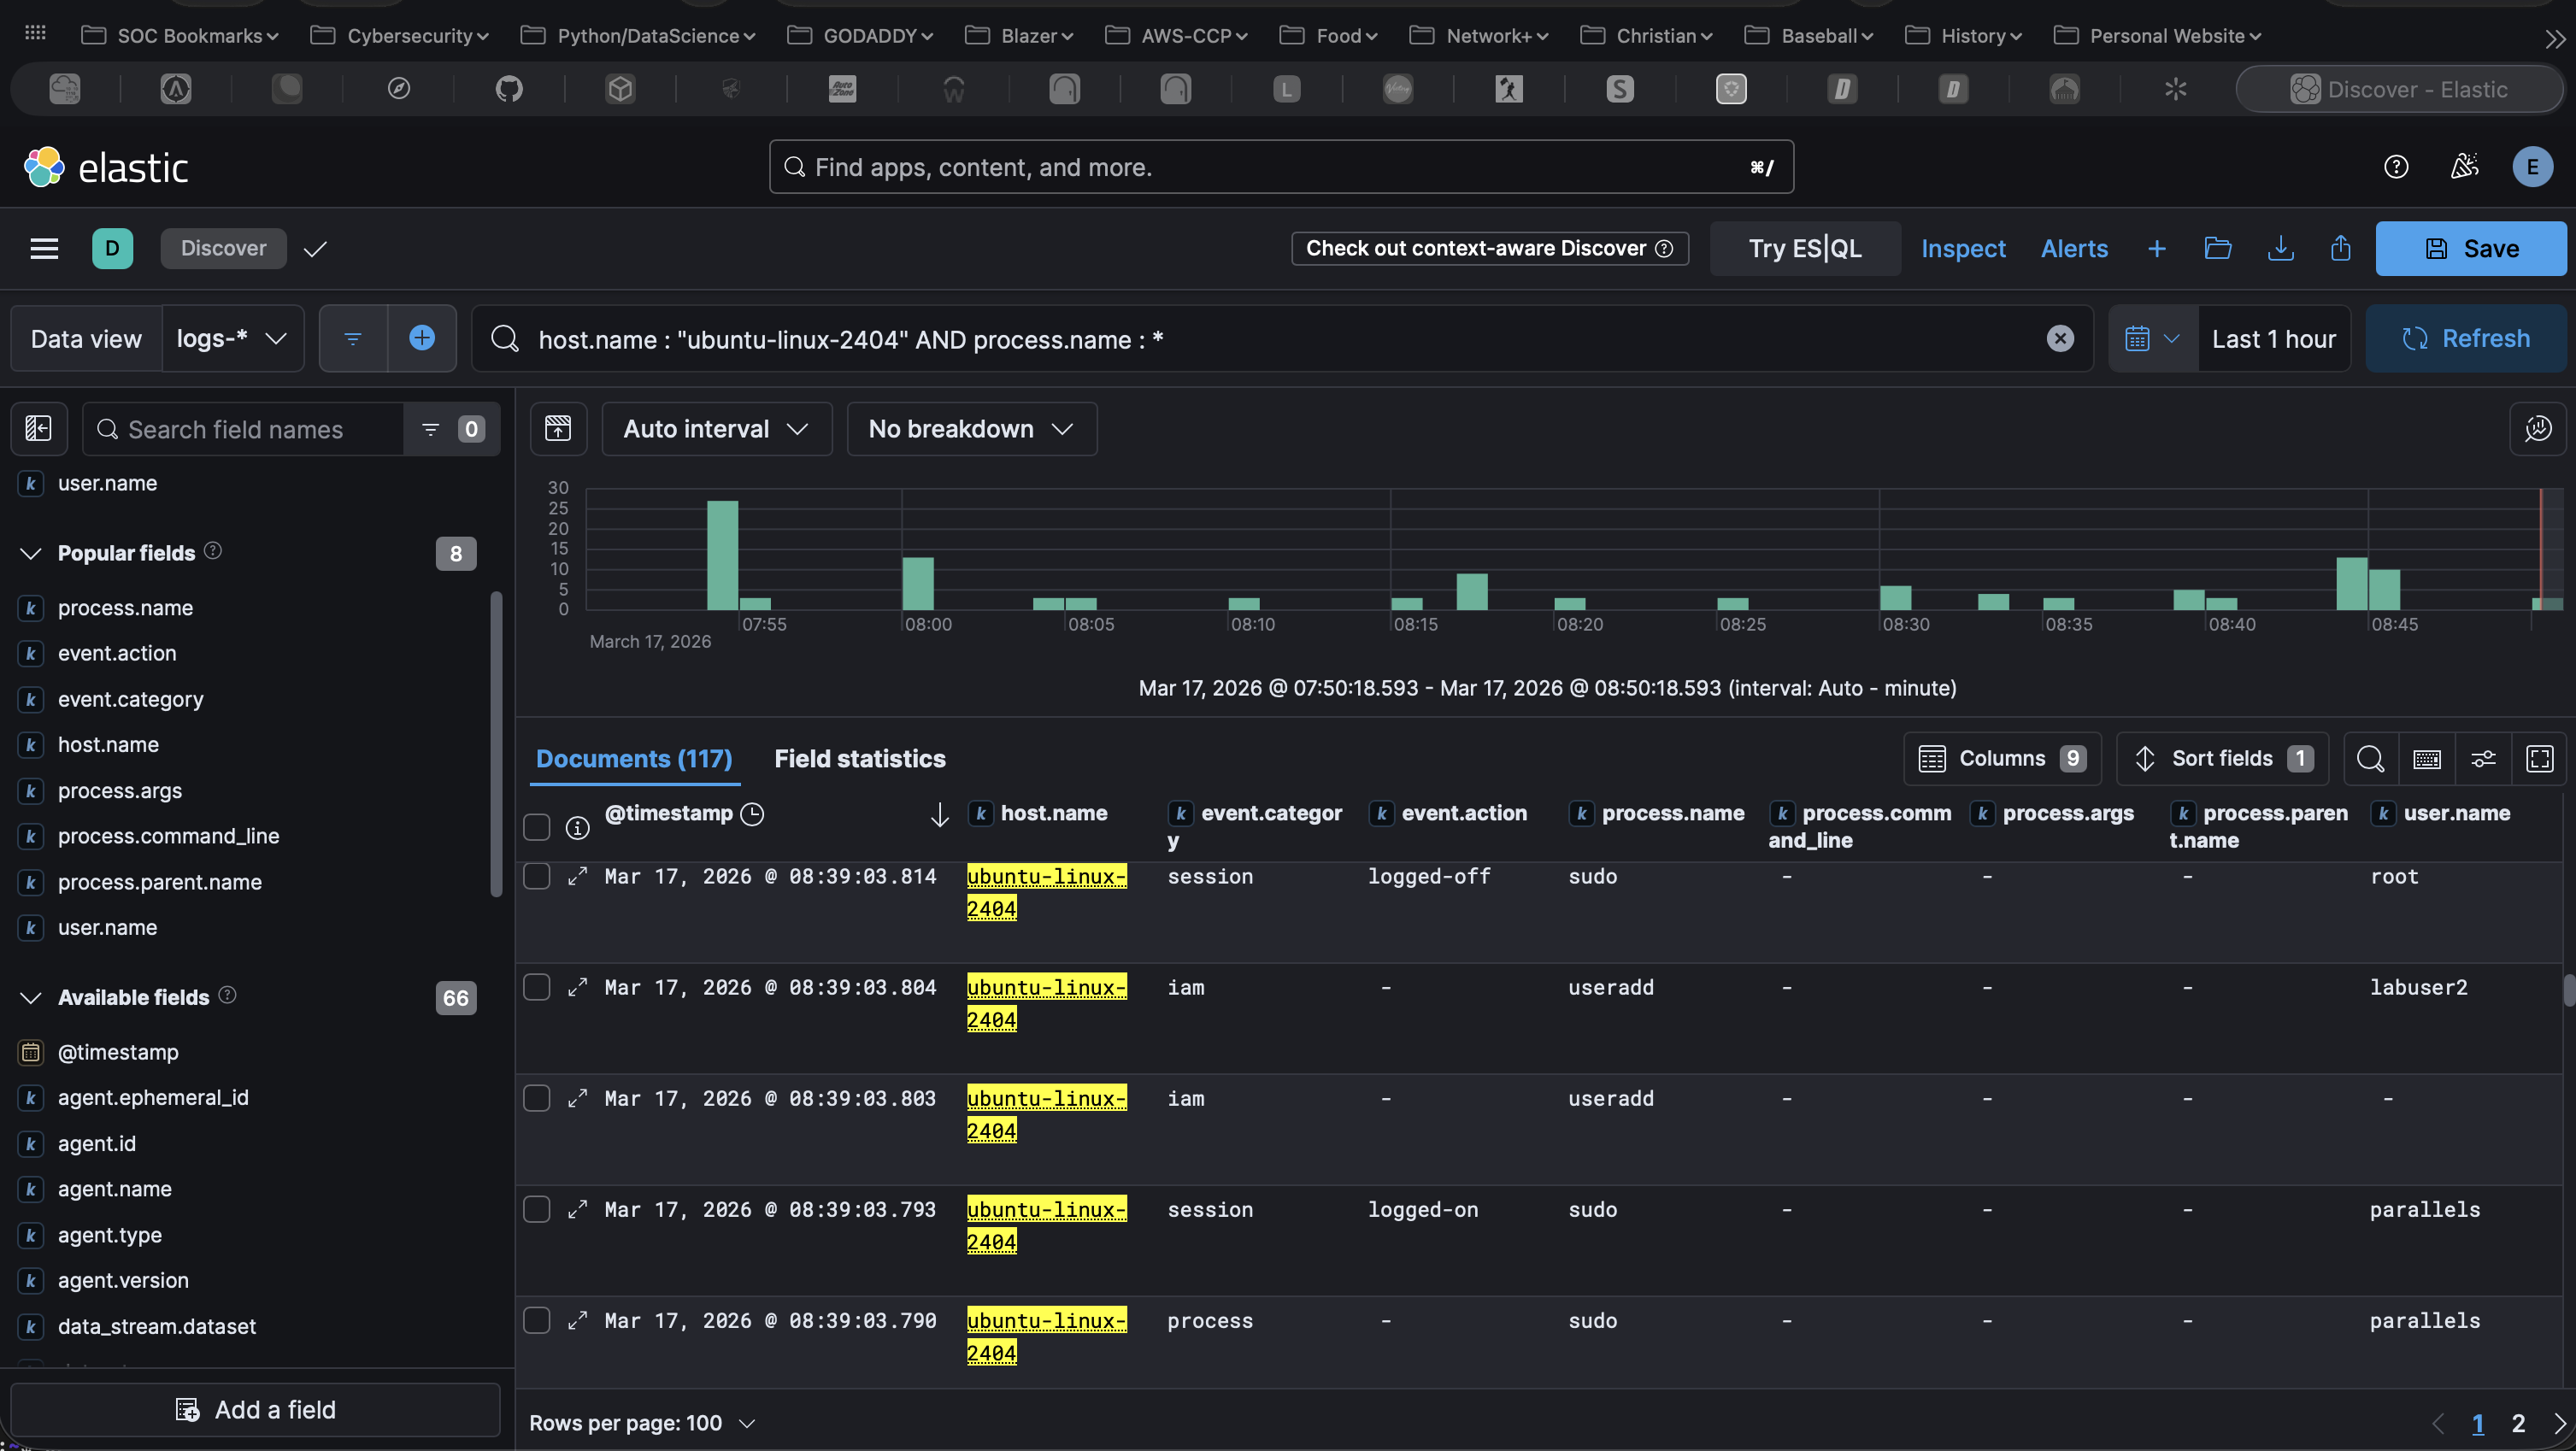
Once the agent was successfully connected, I used Kibana to confirm that data was being ingested. I started in Discover and filtered for my Ubuntu host to verify that logs were coming in.
When setting up the Elastic Defend Policy, I enabled additional settings like session data and terminal capture. For example, when I created a new user on the system (labuser2), I observed an iam event showing that the account was created.
This phase helped me understand the difference between raw telemetry and alerts, and how to search, filter, and interpret endpoint data in Kibana.
Step 1: Install Elastic Agent
tar -xvf elastic-agent-*.tar.gz
cd elastic-agent-*
sudo ./elastic-agent install
Step 2: Retrieve Enrollment Command
Step 3: Enroll Agent into Fleet
sudo ./elastic-agent install \
  --url=https://<fleet-server>:8220 \
  --enrollment-token=<TOKEN_FROM_KIBANA> \
  --insecure
Step 4: Verify Agent Status
sudo /opt/Elastic/Agent/elastic-agent statusStep 5: Apply Elastic Defend Policy to the Ubuntu endpoint in Fleet
Note: Be sure to enable process, file, and network event collection within the policy. Also, enable session data and terminal capture for improved Linux telemetry visibility.
Step 6: Restart Agent
sudo systemctl restart elastic-agentStep 7: Generate Test Activity
sudo useradd labuser2
whoami
ps aux | head
Step 8: Validate Data Ingestion in Kibana
host.name : "ubuntu-linux-2404" AND process.name : *This view helped confirm that process-level activity was being collected from the endpoint, including the useradd command used to create a new user (labuser2).
Phase 3 — Baseline & Data Profiling
In this phase, I moved beyond just collecting telemetry and began focusing on understanding what normal activity looks like on a system.
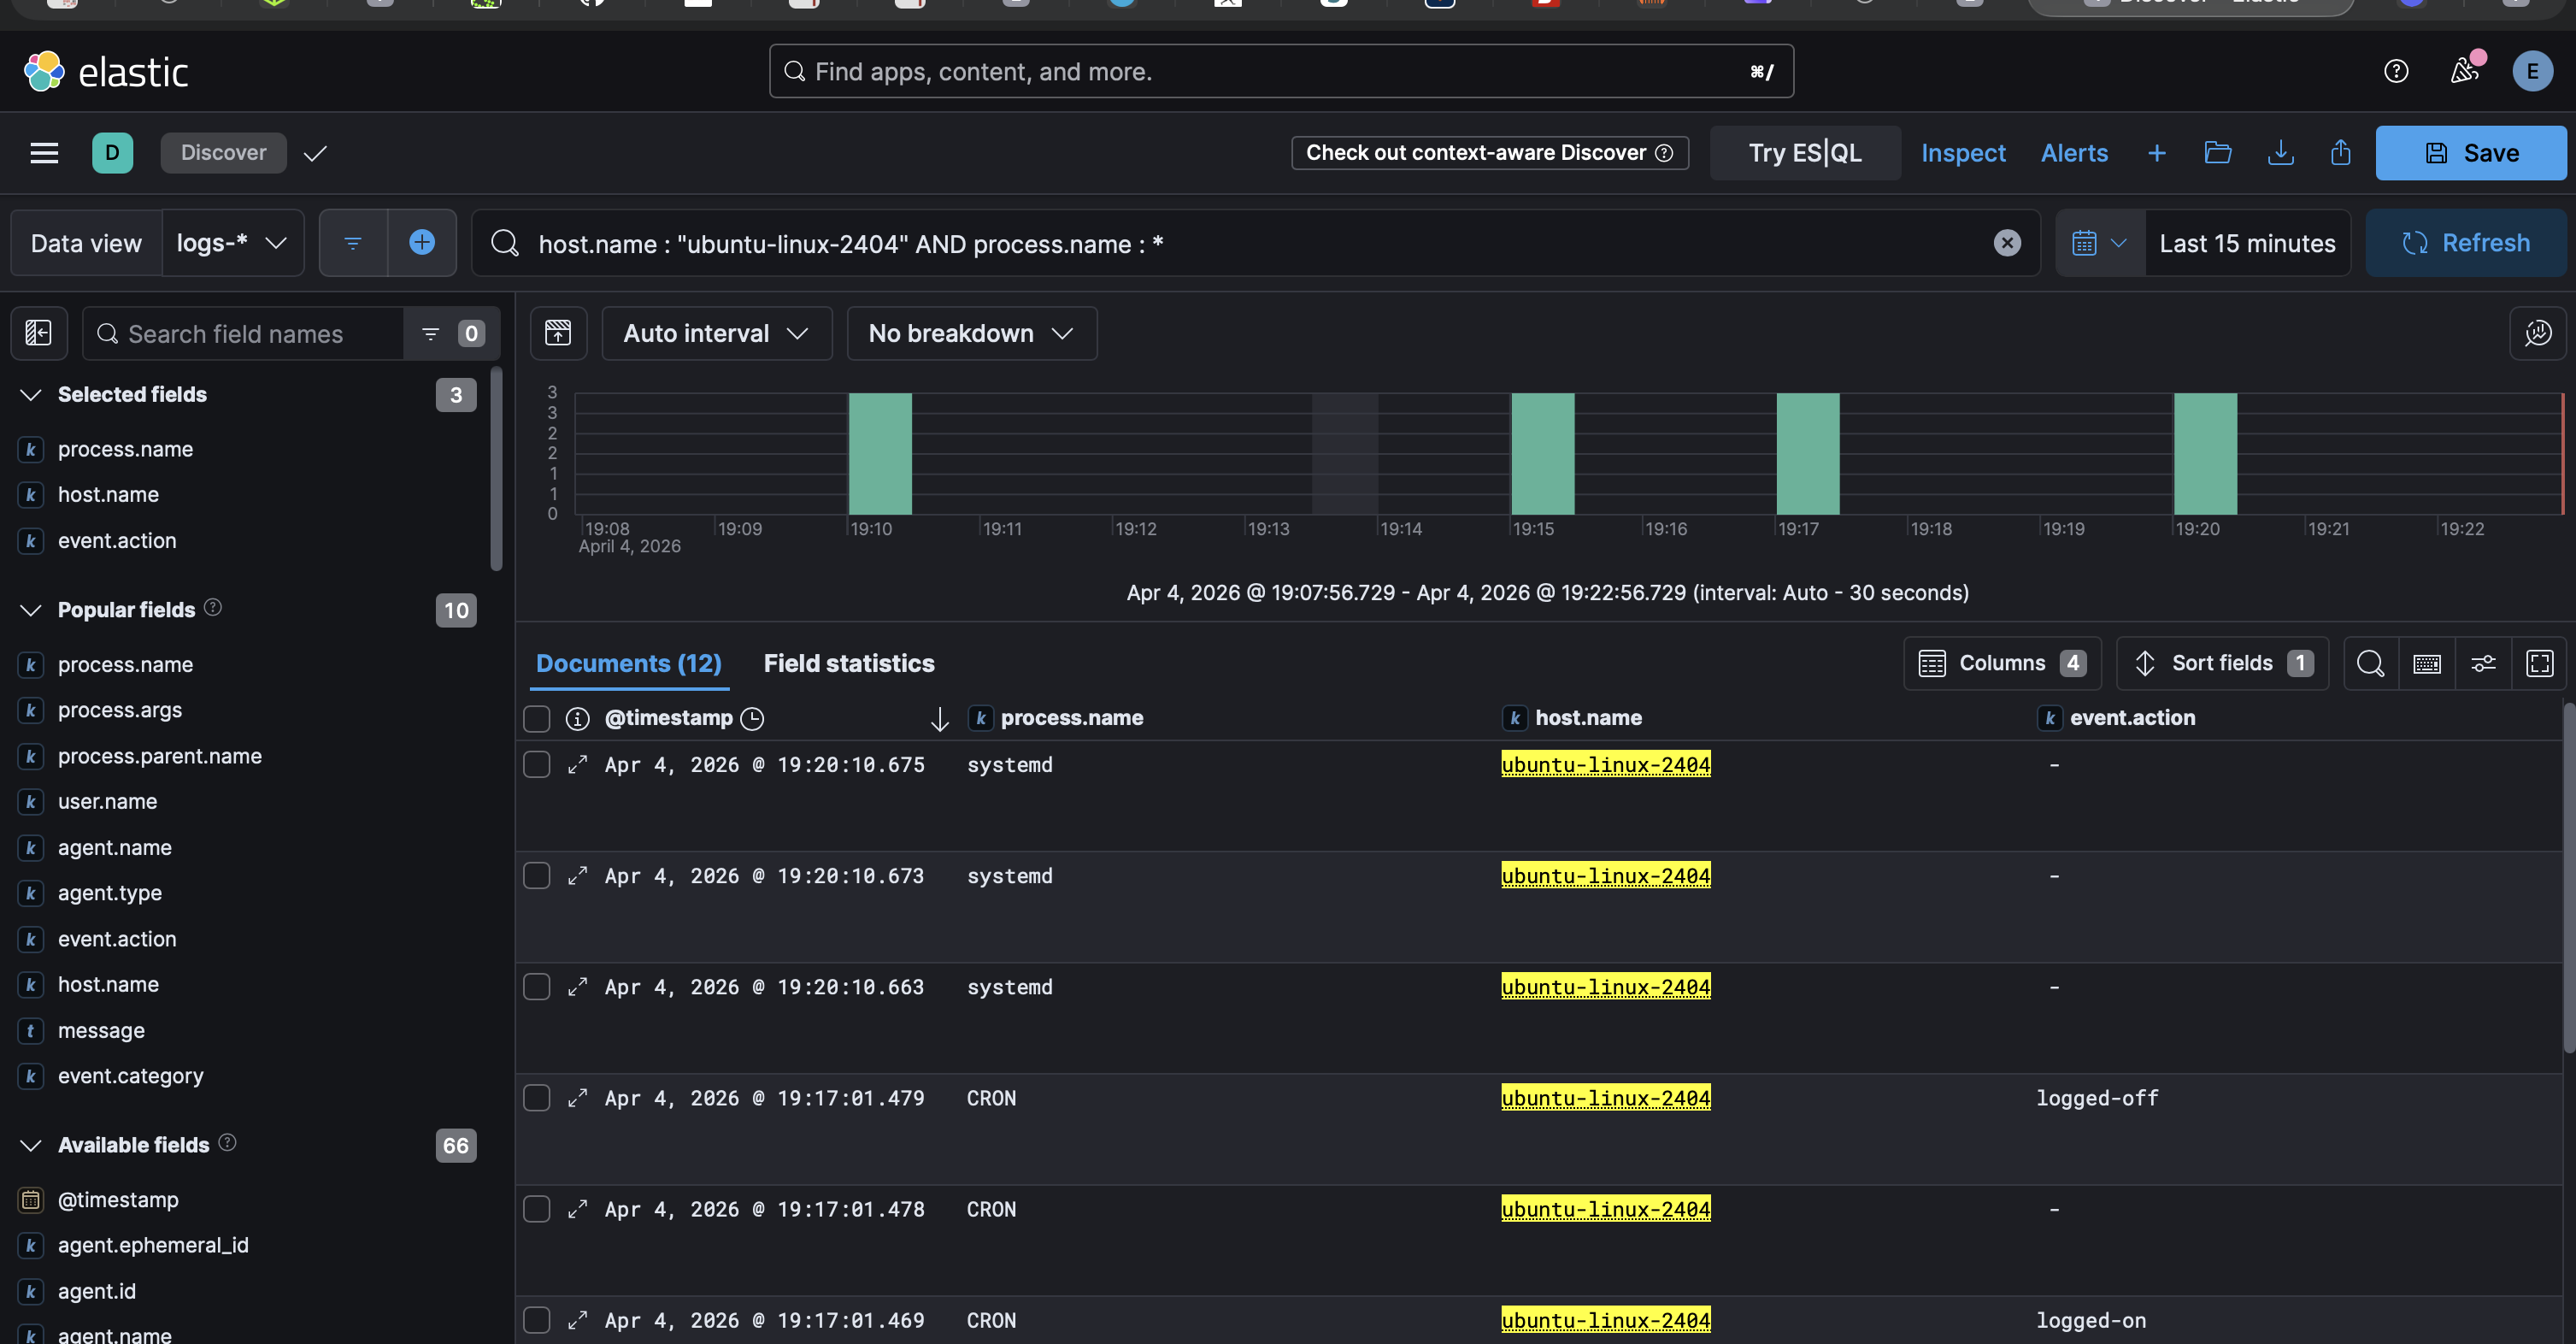
Using the endpoint data collected from my Ubuntu host, I explored different event types in Kibana such as process and IAM events. This helped me understand how system activity is represented in logs and how different event types can be used to analyze behavior.
This phase gave me hands-on experience with exploring endpoint telemetry, filtering logs, and understanding how system activity is represented in Elastic. The focus was on building a baseline of normal behavior before creating any detection rules.
Example Data Exploration
Below is an example of filtering endpoint telemetry in Kibana Discover to analyze activity on the Ubuntu system.
host.name : "ubuntu-linux-2404" AND process.name : *This filter helped identify process-level activity and better understand normal behavior on the system.
Phase 4 — Adversary Simulation (Threat Emulation)
In this phase, I moved from observing normal activity to intentionally generating suspicious behavior on the endpoint. The goal was to create realistic telemetry that could later be used to test detections and investigations.
Using my Ubuntu endpoint, I simulated account creation and privilege escalation activity by creating a new user and then adding that user to the sudo group. This helped me better understand how attacker-like actions appear in Elastic.
After generating the activity, I reviewed the resulting logs in Kibana Discover to confirm the commands were captured.
High-Level Steps: Threat Emulation
- Selected Ubuntu as the endpoint for threat emulation.
- Generated user creation activity on the endpoint.
sudo useradd phase3user- Simulated privilege escalation by adding the user to the sudo group.
sudo usermod -aG sudo phase3user- Navigated to Kibana → Discover.
- Filtered endpoint activity to review the generated events.
host.name : "ubuntu-linux-2404" AND process.name : ("useradd" or "usermod")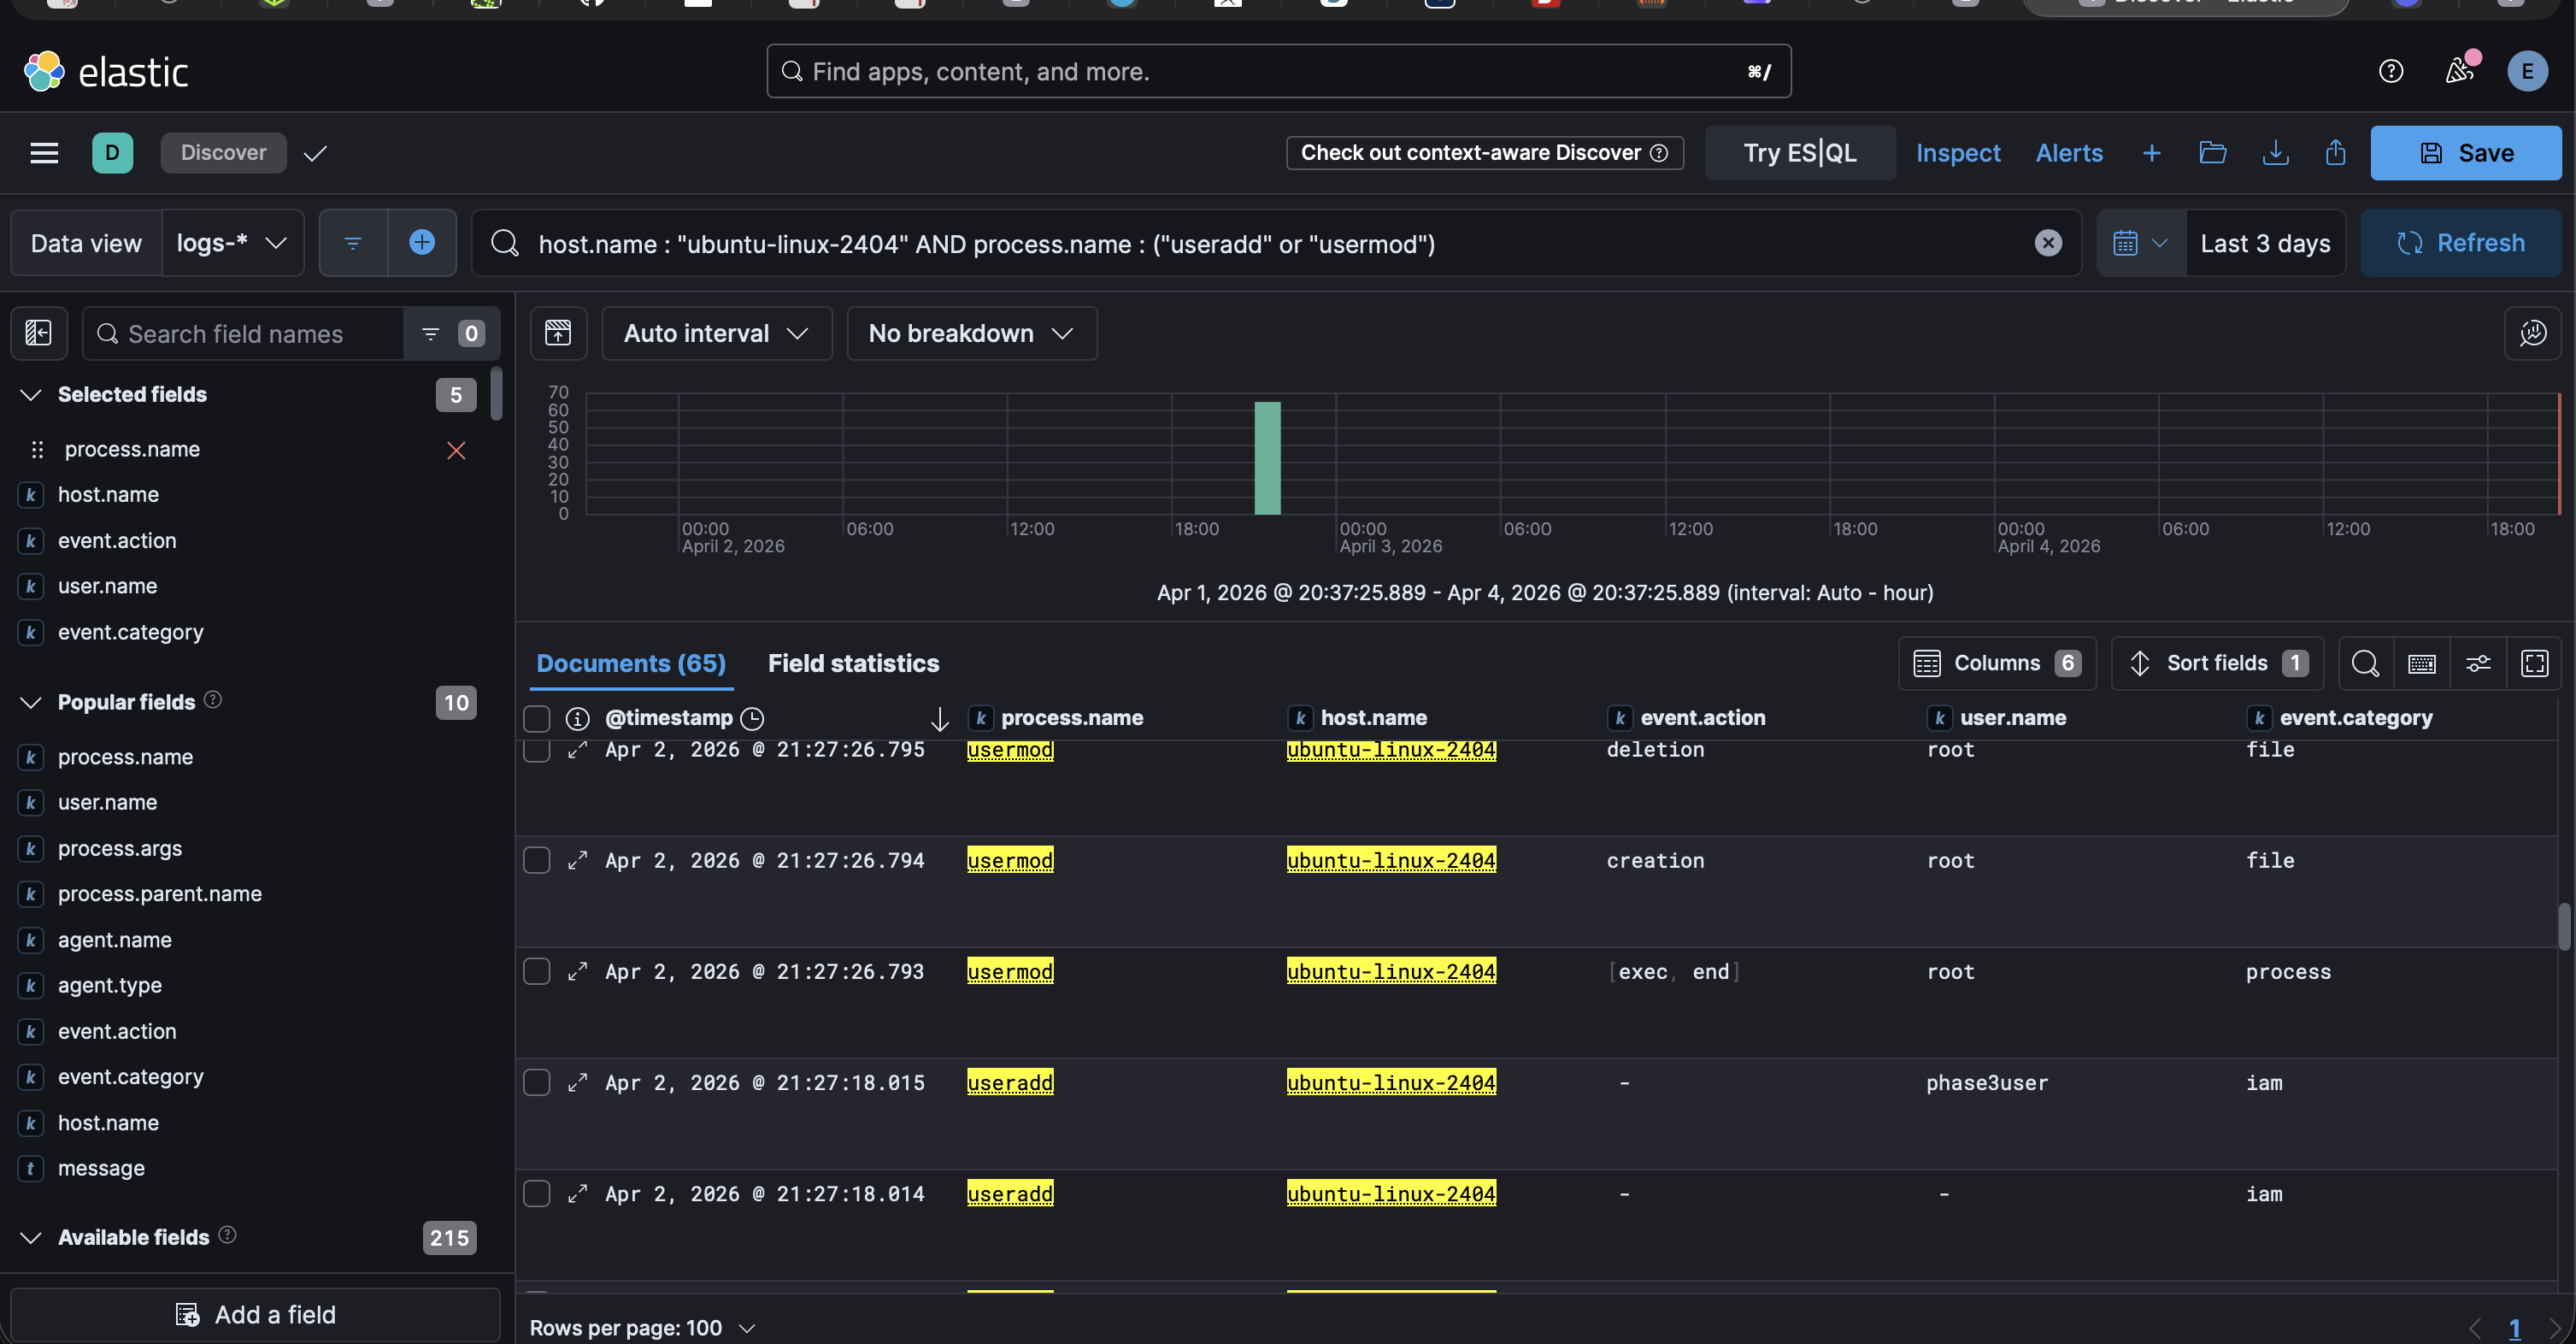
- Reviewed how the activity appeared in different event categories, including process and IAM events.
I also simulated network reconnaissance activity by running an nmap scan from my Kali VM against the target Ubuntu endpoint. This helped generate network and process telemetry that reflects how an attacker might scan for open ports and services.
This activity will be used in the next phase to build and validate detection rules for identifying network scanning behavior.
To be continued...
In the next phase, I focus on creating and validating detection rules from the emulated activity.